
Year-to-date, Palladium has been the place to be in the precious metals complex, although shorter-term silver is seeing the greater percentage move. With Gold, its slower-moving cousin grinding into $1800.
Gold is where we’ve seen the bulk of our flow though and while that’s partly a function of our low cost to trade (i.e, spread), the question posed is whether after this period of consolidation and sleepy conditions, are we going to see range expansion, and more favourable conditions for short-term traders?
(Gold daily)
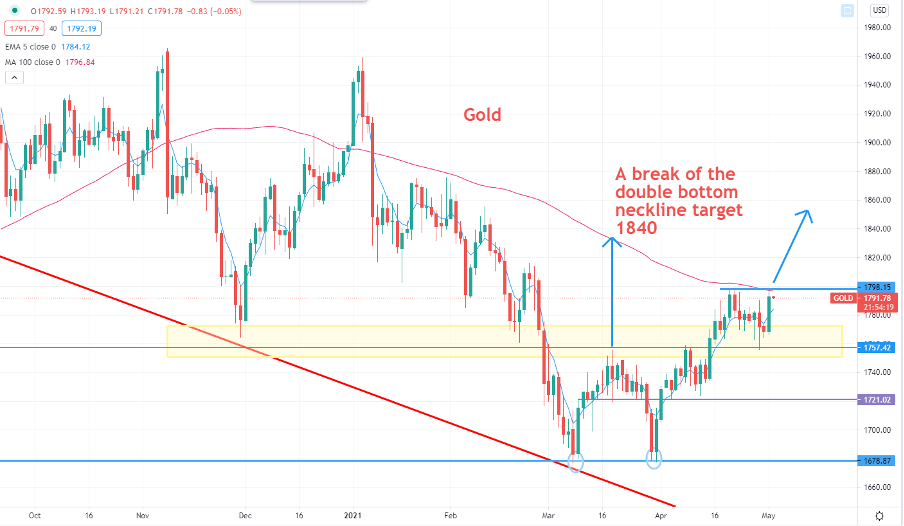
(Source: Tradingview)
One look at the daily chart we see price keenly trying to break the 22 April high of 1797 and as mentioned, the 100-day MA. A break here could take the metal into the 1840/50 range, perhaps 1875 – with 1840 the target set from the recent double bottom. It’s hard to take a bearish view on any time frame past the 4-hour chart, at least until the price pushes below 1765 and momentum flips. As with any position using CFDs my preference is to buy strength and sell weakness.
Assessing key trading considerations
When we look at positioning, we can see from CFTC data that net positioning held by money managers at 50,561 contracts – this is 78% lower than the 238,000 contracts seen last February. In the ETF space, close to 10m oz of gold have been sold, with the last week of net inflows into the GLD ETF (gold ETF) back on 19 March - positioning in gold is as clean as we’ve seen for some time.
In the options world, traders are unconvinced by this recent move higher, with 1-month implied volatility commanding a 2.8 vol discount to 1-year implied volatility – this portrays a market (rightly or wrongly) not expecting a near-term explosive move, and more of the same grind in price action.
(Top pane – 1w – 1year gold implied volatility, lower – 1m call – put volatility)
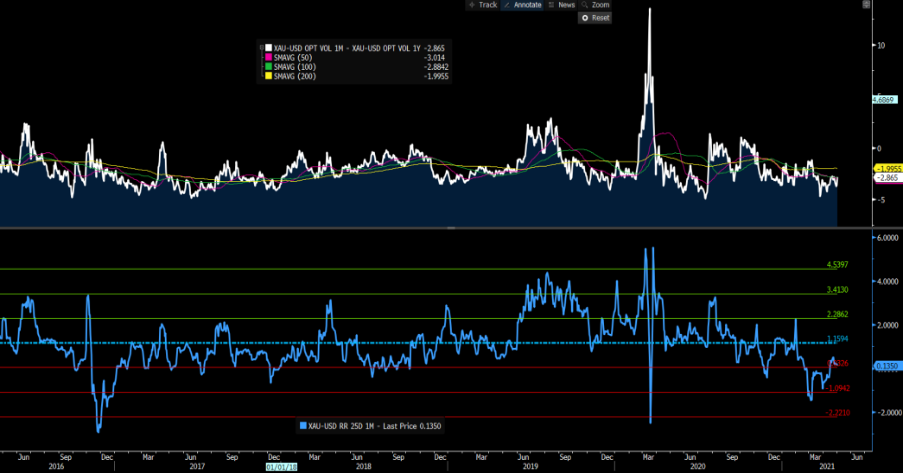
We can also see that gold 1-month put option (25 delta) implied volatility trades at a 0.135 vol premium to 1-month call volatility – one standard deviation from the five-year average. This differential remains one of my favourite sentiment guides and speaks of a market still favouring paying up for downside protection in gold than upside.
Real rates drive gold
For those who use fundamentals to make trading decisions, the need to understand what genuinely holds the strongest influence on gold can help with our edge.
Some have made the distinction of using gold as an inflation hedge, which is what the textbooks tell us gold is good for – notably, this narrative has become more mainstream with inflation expectations pushing to 2.42% and the highest levels since April 2013 - I’ve looked at the ‘breakeven’ rate or average expected inflation over the coming 10-years (see the St Louis Fed site for details).
Running the numbers, we see the rolling 30-day correlation between gold and 10-year breakeven rate at just 0.36. This hardly screams of a market buying gold as an inflation hedge just yet.
(Top pane – 5y – 2yr breakeven rates, lower – 10yr – 2yr breakeven rates)
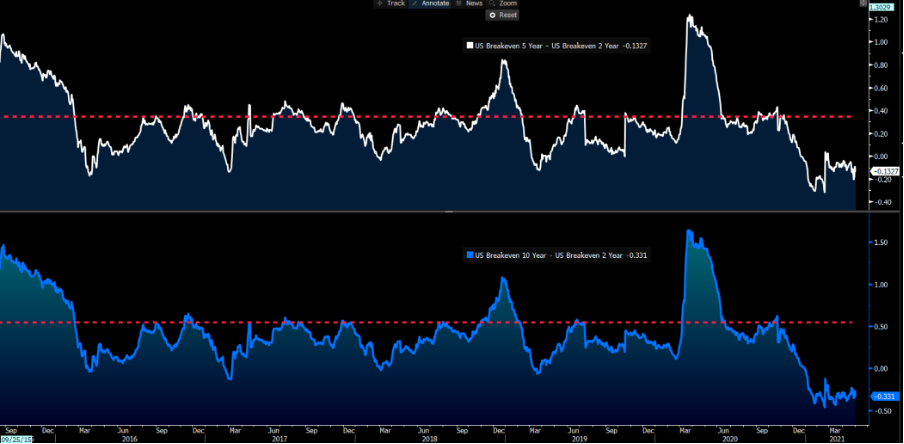
(Source: Bloomberg)
That day may well still come, yet while inflation expectations have indeed risen, it's the point when longer-term inflation expectations rise above short-term expectations when Gold should really see movement. Looking at the breakeven market again, we see both 5 and 10-year expectations at a discount to 2-year inflation expectations – if that changes, Gold will move aggressively. As it would portray a market that no longer shares the Federal Reserve’s view that inflation is indeed ‘transitory’ and that price pressures are going to result in a shock to the system.
Gold is a play on real Treasury yields
Arguably Golds greatest influence is the ‘real’ Treasury market or TIPS (Treasury Inflation Protected Securities). The rolling correlation between gold and 10-year real yields sits at -0.905, which means that 90% of the variance in gold can be explained by real rates. In essence, if inflation-adjusted Treasury yields are falling – or becoming increasingly negative – then Gold will rise and vice versa. By taking a long view on Gold, you’re taking a view that real rates will head deeper into negative territory.
(10yr real US Treasury yields)
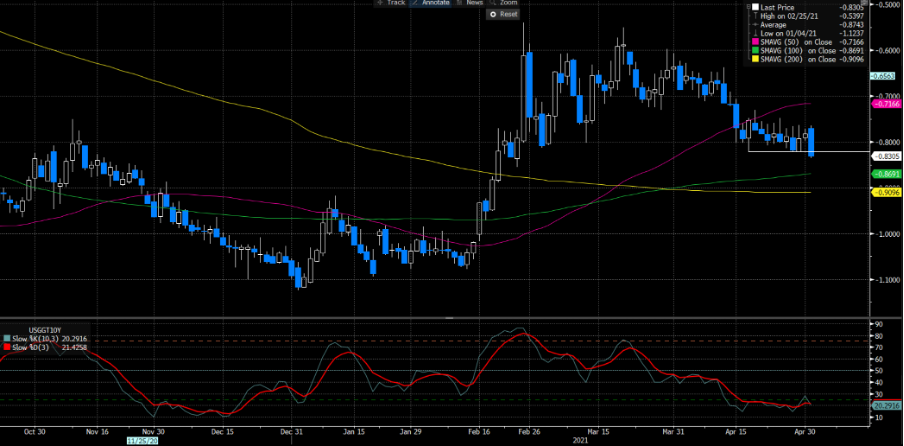
(Source: Bloomberg)
As we see from the chart, 10-year real rates have broken below the recent consolidation zone and this has pushed gold up to a breakout point. As a yield less asset, there's an opportunity cost for holding Gold – so the less negative expected inflation-adjusted returns become in the bond market, the less compelling the investment case for holding Gold.
So Gold bulls will want to see real Treasury yields push deeper negative – this means inflation expectations rising at a faster clip than Treasury yields. That's a tough call given inflation expectations have risen substantially – in effect, this week’s US payrolls should be key – if the numbers are hot (i.e, above 1m) this should lift real yields and weigh on Gold. Any signs of weaker data in the US and real yields should fall, which is what we saw after the April ISM manufacturing report.
At this stage, given the setup in the bond market, it feels like the risk resides to the upside for Gold. That said, should we see the data flow start to really meet the Fed’s “substantial progress test” and as we head into August, then the risks are real yields start to rise and that would act as a handbrake on the Gold market. Interesting times ahead clearly for Gold traders.
Related articles


Bereit zu traden?
Es ist einfach, ein Pepperstone-Konto zu eröffnen. Stellen Sie Ihren Antrag innerhalb von Minuten, auch mit einer geringen Einzahlung. Beginnen Sie Ihre Reise mit Pepperstone noch heute.
Diese Information wurde von Pepperstone GmbH bereitgestellt. CFD sind komplexe Instrumente und beinhalten wegen der Hebelwirkung ein hohes Risiko, schnell Geld zu verlieren. 73,9 % der Kleinanlegerkonten verlieren Geld beim CFD-Handel mit diesem Anbieter. Sie sollten überlegen, ob Sie verstehen, wie CFD funktionieren und ob Sie es sich leisten können, das hohe Risiko einzugehen, Ihr Geld zu verlieren. Diese Inhalte stellen keine unabhängige Finanzanalyse dar, sondern gehören zu unserer Werbemitteilung. Folglich sind die gesetzlichen und regulatorischen Bestimmungen, die sich auf unabhängige Finanzanalysen beziehen, nicht auf diese Website und unsere Kommunikation anwendbar. Diese Inhalte (unabhängig davon, ob sie Meinungen wiedergeben oder nicht) dienen nur der allgemeinen Information und berücksichtigen Ihre persönlichen Umstände oder Ziele nicht. Obwohl die in dieser Werbemitteilung enthaltenen Informationen aus Quellen, welche als verlässlich betrachtet werden können, bezogen wurden, gewährleisten weder Pepperstone noch der Autor die Richtigkeit oder Vollständigkeit dieser Informationen. Alle Informationen sind nur indikativ, können ohne vorherige Mitteilung abgeändert werden und können jederzeit veraltet sein. Weder Pepperstone noch der Autor übernehmen Haftung für Verluste. Informationen über die frühere Wertentwicklung eines Finanzinstruments lassen keine verlässliche Schlussfolgerung auf die zukünftige Entwicklung zu. Die Rendite kann infolge von Währungsschwankungen steigen oder fallen kann.