Margin trading products are complex instruments and come with a high risk of losing money rapidly due to leverage. 88% of retail investor accounts lose money when trading on margin with this provider. You should consider whether you understand how margin trading works and whether you can afford to take the high risk of losing your money.
- English
Euro jumps on stimulus package while volume remains low in ‘risk on’ markets

With the expectation of some of the Eurozone’s economies to shrink by as much as 10 percent this year, it remains to be seen how many of these types of bailouts will be required before a real recovery to growth starts. This news, coupled with early re-opening optimism has led to a ‘risk on’ sentiment in all asset classes, with indices and the Euro rallying alongside a decline in gold and other safe-haven assets.
US unemployment jobless claims rise but continue to drop week on week
Unemployment claims continue to mount with the figure now reaching 40.8 million in the last 10 weeks after yesterday’s 2.1 million filing. This news initially seemed to not upset the markets, with the main movement coming from the USDX which weakened on the expectation of further stimulus requirements in the future to combat these numbers.
Indices remained strong, and it seems that the market participants are supremely confident that the federal reserve, and indeed the governments of the world will help bailout almost any situation moving forward. This could be a dangerous assumption, and with the Volatility index still above 30, obviously many investors are thinking the same thing.

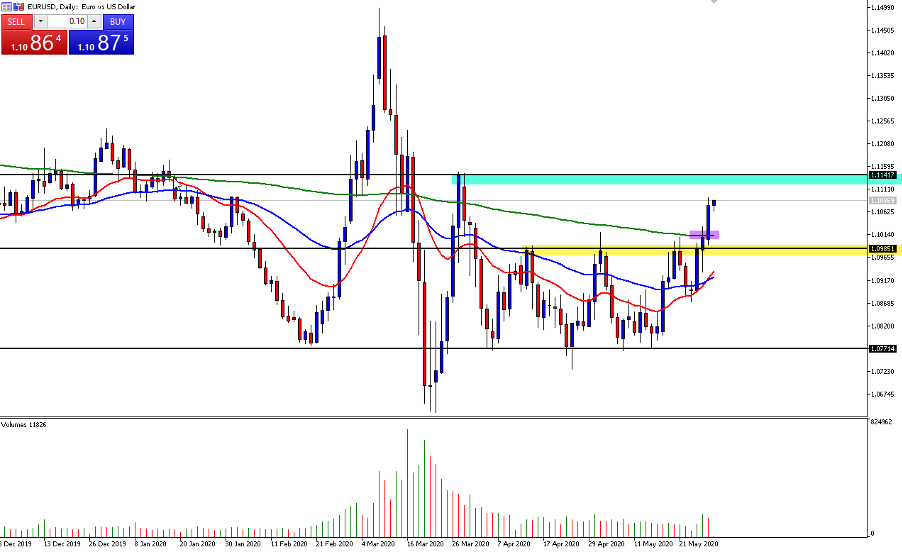
The EURUSD chart above finally closed above the channel (highlighted in yellow) this week, with price breaking above the 1.1000 area and closing above the psychological zone. This move has been met by an increase in volume as shown on the chart above, with the initial large increase in trading volume starting to dwindle since April.
Price has continued to find strength with the 200 SMA (highlighted in purple) acting as only a temporary resistance, before moving above and resuming its path in the direction of the channel pattern break. The area highlighted in green at 1.11500 remains the next point of strong resistance on the charts, with the news of further Euro stimulus acting as a catalyst for more buying momentum. The all-important 20 exponential moving average (red line) has also moved above the 50-exponential moving average (blue line), signalling more bullish strength for the euro on the daily chart.
USDX Channel breaks but is now met by a key support

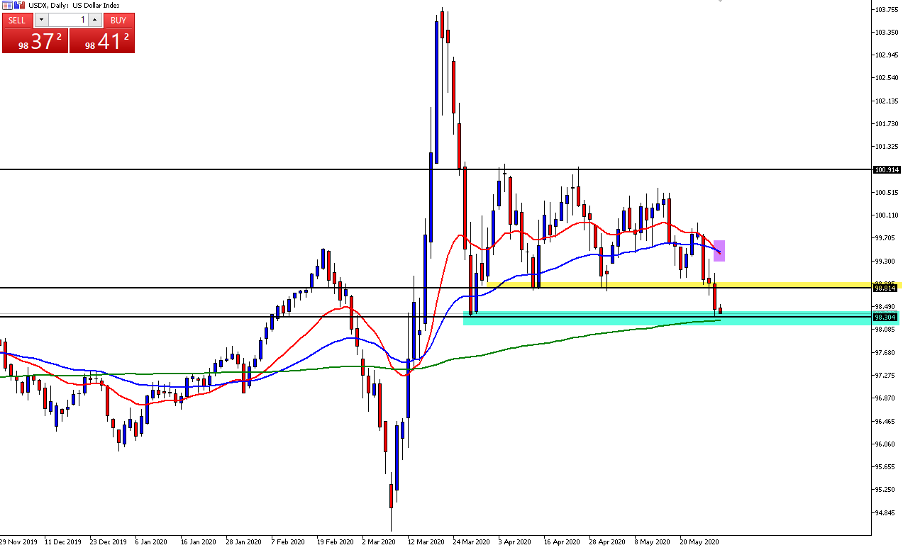
The unemployment filings last night were a catalyst for further dollar weakness, with price diving below the 98.80 support (highlighted in yellow) and continuing to weaken during after-hours trading. The USDX now sits at a point of heavy support, with the 200 simple moving average and previous support at 98.30 (highlighted in green) acting as a blocker for what should be a continuation point for US dollar weakness.
The 20 exponential moving average (red line) is also about to cross the 50 exponential moving average (blue line) signalling further weakness, so expect the bears to be firmly in control if price closes below the 98.30 zone over the next week.
AUDUSD Hits Critical Resistance

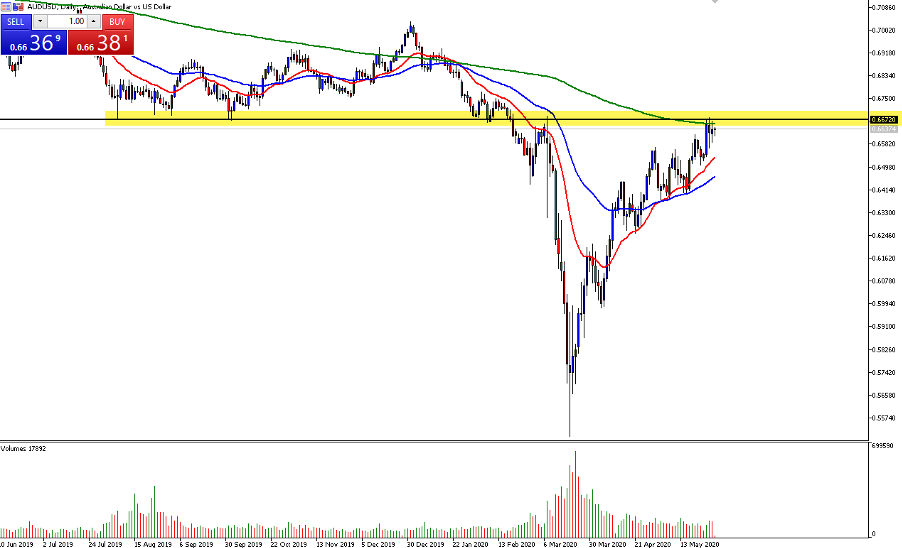
The chart above shows that volume has also been reducing on the AUDUSD after a sharp spike in March during the peak of the crisis. Price has remained attached to the strength in the S&P 500 index for several weeks now, and the AUDUSD has now reached a critical juncture.
The area highlighted in yellow at 0.66800 shows previous support during August, September and January has now become resistance, and price now sits at a key level, with the 200 simple moving average (green line) providing further dynamic resistance. A fundamental catalyst will most likely be required to drive price higher, with immediate risk seen to the downside over the coming week.
The calm before the storm?

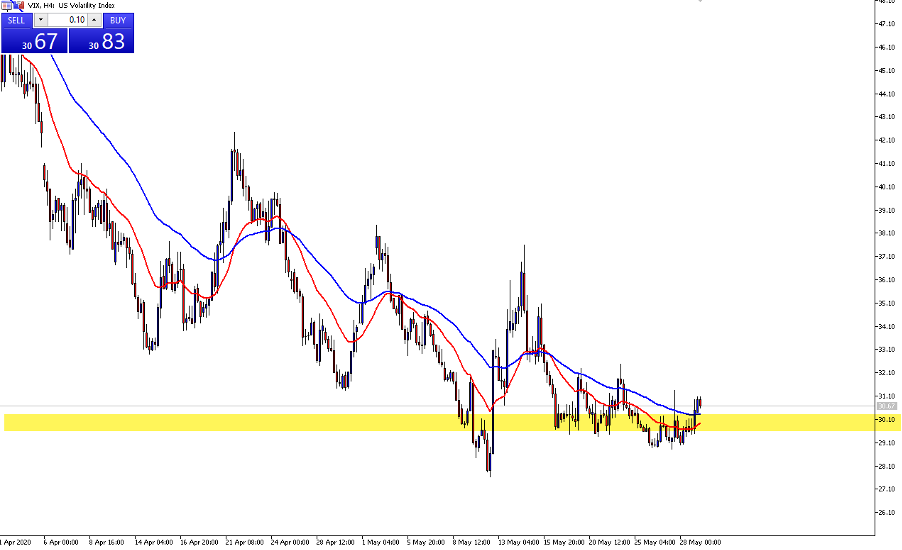
The curious case of the volatility index (VIX) remaining so high during a ‘risk on’ period in both the stock and currency markets remains a concern. The VIX generally declines while ‘risk on’ assets improve in price, but this has not happened during this crisis, with the VIX hovering above the 30 level while other key levels are broken by other asset classes.
Could the VIX be indicating that the market is still incredibly concerned and just not showing it? The key to navigating this uncertain period is always having a trading plan and strong risk management to avoid getting caught if the volatility returns.
Related articles
Ready to trade?
It's quick and easy to get started. Apply in minutes with our simple application process.
The material provided here has not been prepared in accordance with legal requirements designed to promote the independence of investment research and as such is considered to be a marketing communication. Whilst it is not subject to any prohibition on dealing ahead of the dissemination of investment research we will not seek to take any advantage before providing it to our clients. Pepperstone doesn’t represent that the material provided here is accurate, current or complete, and therefore shouldn’t be relied upon as such. The information, whether from a third party or not, isn’t to be considered as a recommendation; or an offer to buy or sell; or the solicitation of an offer to buy or sell any security, financial product or instrument; or to participate in any particular trading strategy. It does not take into account readers’ financial situation or investment objectives. We advise any readers of this content to seek their own advice. Without the approval of Pepperstone, reproduction or redistribution of this information isn’t permitted.
