- English
- 中文版
In turn, the cost of capital rises and the present value of expected equity cash flow falls. The change in equity risk premium (ERP) offers equity markets a lower cushion which matters when valuation is still highly elevated – technical I know, but these are all factors’ investors strongly consider when bond yields are rising like we’re seeing.
While many ramp up interest in US Q1 earnings, one questions if it will it be enough to offset a rising rates environment? I think the market is voting loud and clear here…
What we’re also hearing about is option flow, specifically, talk of market markers and dealers obtaining a decent short gamma position ahead of options expiry (21 January), both in single share CFDs and in US equity indices CFDs. Higher rates may be the root of the issue, but flow is what we trade and as the markets tick lower, dealers are shorting S&P 500 and NAS100 futures to dynamically hedge – this simply exasperates the moves in equities.
What is the odds we get a snapback in risk post options expiration (21 January) when dealers decide to cover these shorts?
We’ve also broken some key levels in various index benchmarks and talk on the floor is that CTAs (Commodity Trading Advisors - trend followers) have been reducing longs in S&P 500 futures, amid deteriorating top of book liquidity – again, if a player wants to get out and the liquidity isn’t there at the quoted bid price, then they’ll move the market far more easily. And of course, it’s the job of the trader to make sure the market and algos don't know there is a big seller out there.
While Crude is attempting to break out and bond yields are trending higher, there is enough uncertainty to cause a move out of US assets. However, this tends to be an environment where the short sellers do some of their best work.
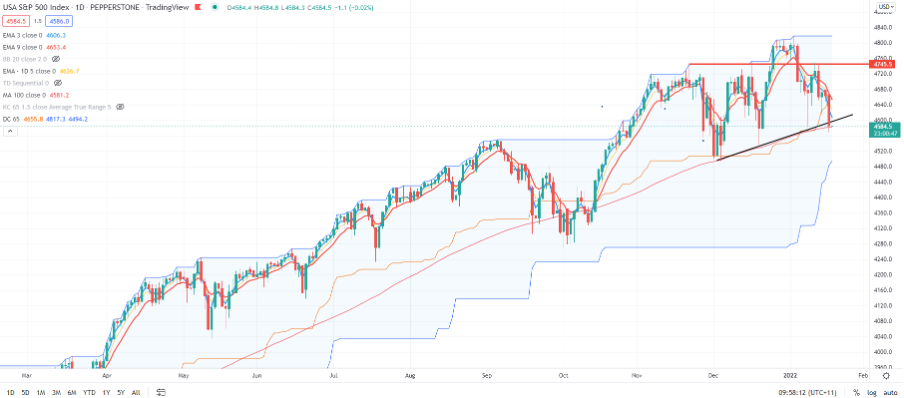
S&P 500 daily chart

(Source: TradingVIew - Past performance is not indicative of future performance.)
We thought 2022 would be a lively time in markets and when you ‘don’t fight the Fed’, we’re seeing this now in the trend. The dip buyers will hope the US500 holds the 100-day MA, which is where price resides, but a break here should take us into 4500 – a round number and lower donchian channel (65-day look back). The NAS100 has broken down and a move through 15,162 takes us to 14,382.
Related articles
Ready to trade?
It's quick and easy to get started. Apply in minutes with our simple application process.
The material provided here has not been prepared in accordance with legal requirements designed to promote the independence of investment research and as such is considered to be a marketing communication. Whilst it is not subject to any prohibition on dealing ahead of the dissemination of investment research we will not seek to take any advantage before providing it to our clients. Pepperstone doesn’t represent that the material provided here is accurate, current or complete, and therefore shouldn’t be relied upon as such. The information, whether from a third party or not, isn’t to be considered as a recommendation; or an offer to buy or sell; or the solicitation of an offer to buy or sell any security, financial product or instrument; or to participate in any particular trading strategy. It does not take into account readers’ financial situation or investment objectives. We advise any readers of this content to seek their own advice. Without the approval of Pepperstone, reproduction or redistribution of this information isn’t permitted.


