- English
- 中文版
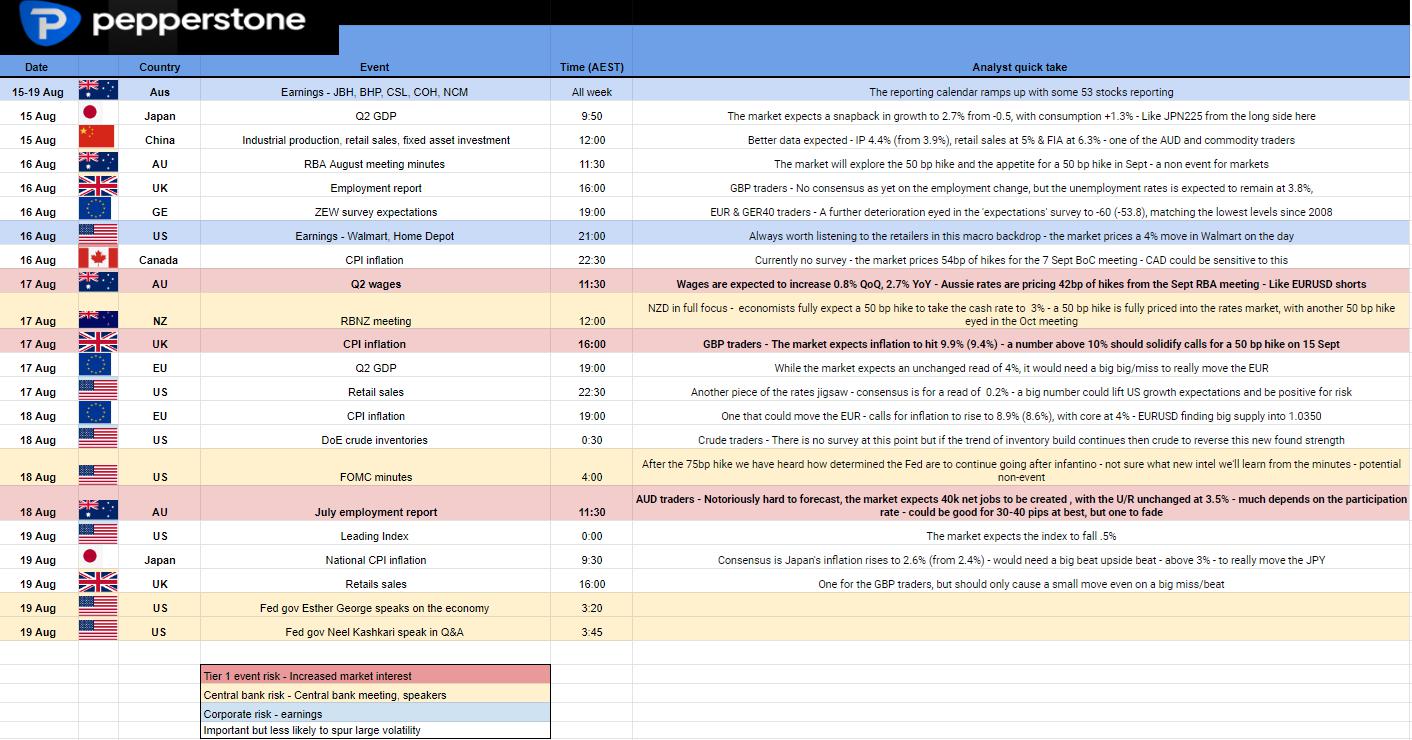
You can see the expectations in the calendar, but one should consider how they will affect rates pricing and how this impacts the margin FX markets.

As it stands, the market feels on balance that we’ll get a 50bp hike from both the BoE and RBA at their respective September central bank meetings, with the RBA expected to hike 150bp cumulative this year, and the BoE 120bp.
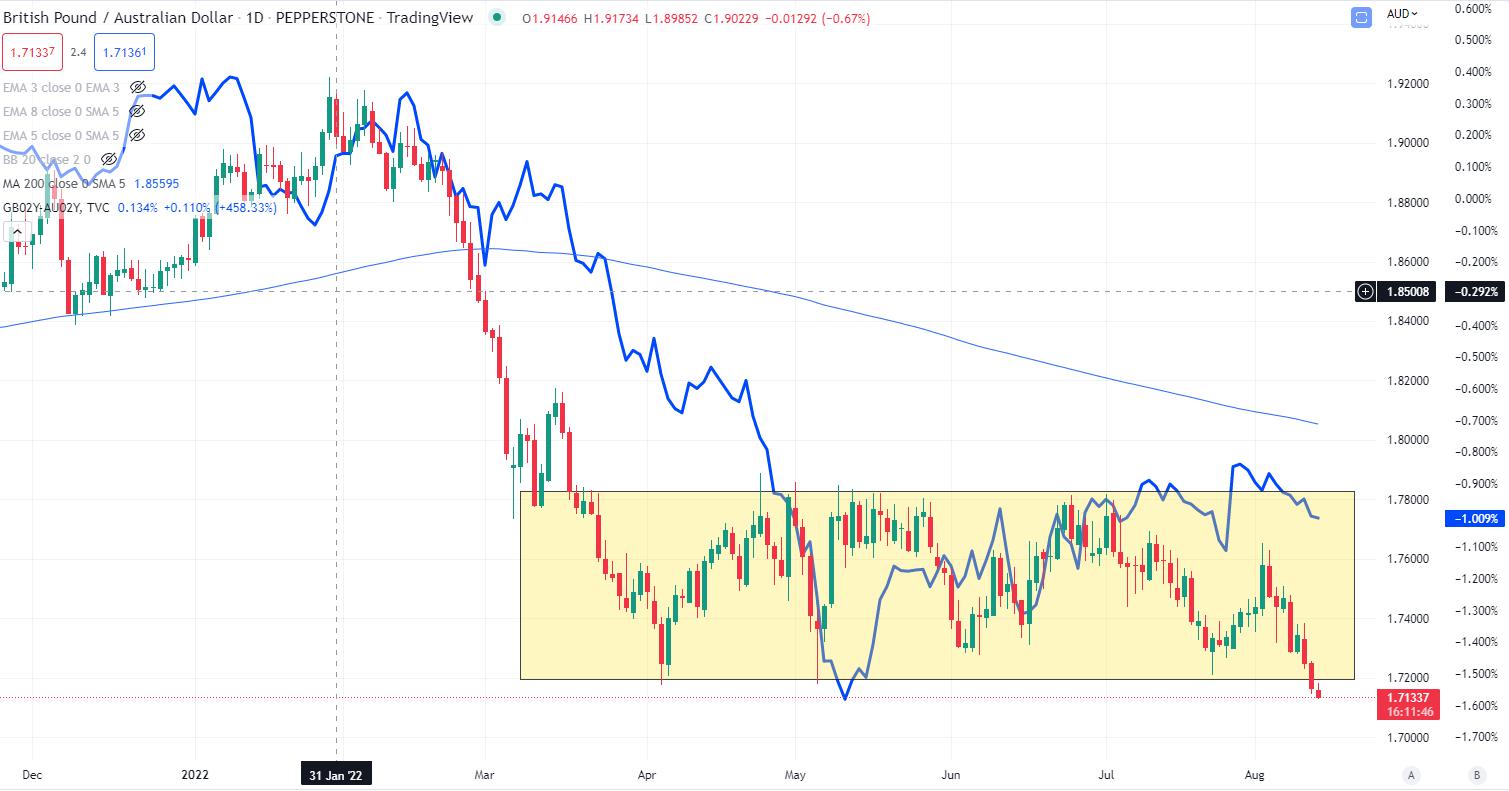
One way we can assess this is by relative expected interest rate differentials, or through short-term bond yield differentials – the 2-year maturity is a good place to start. We can see that the yield advantage to hold Aussie bonds over UK gilts (unhedged) is providing an element of support for the AUD, but a simple overlap between the UK–Aus 2-year bond yield spread and GBPAUD has diverged and GBPAUD trades at a reasonable discount to where the spread resides.
GBPAUD vs UK2 – Aus 2-year bond spread

Taking a tactical view - while we know the Aussie labour market has been strong for some time, it feels as though the market will be far more shocked by a poor jobs number than a strong level of job creation. Aussie wages are naturally the backbone of inflationary pressures, so this data point counts, and we know the RBA forecast CPI inflation at 7.75% by Dec-22 – so big numbers here could put that forecast under review. Either way, it’s hard to see a world where we get more than 50bp in Sept from the RBA, but a big number – say 2.9% - 3% - and we’ll see hikes in 2023 lift sharply. Credit Suisse are the outlier call with a 3.2% estimate, which if comes to fruition will light up the AUD.
UK CPI could be quite influential – we know the BoE is forecasting inflation to breach 13%, so a number north of 10% here could get the GBP fired up. A number below 9.5% could bring out good GBP sellers – granted inflation is still at very high levels, but we’re talking nuance, and GBP will fall on a decent miss.
What’s important here is the flow of capital and how traders see things here and now – we see in the daily chart that GBPAUD is breaking down through the 1.7830 to 1.7200 range. Is this significant? Is this the start of a more bearish trend and a new lower range?
It certainly feels like this could be the case. Range breaks naturally get more meaning when the range is mature in duration, as is the case here – to me, this feels significant. Is 1.7000 by next Friday out of the question?
Related articles
The material provided here has not been prepared in accordance with legal requirements designed to promote the independence of investment research and as such is considered to be a marketing communication. Whilst it is not subject to any prohibition on dealing ahead of the dissemination of investment research we will not seek to take any advantage before providing it to our clients. Pepperstone doesn’t represent that the material provided here is accurate, current or complete, and therefore shouldn’t be relied upon as such. The information, whether from a third party or not, isn’t to be considered as a recommendation; or an offer to buy or sell; or the solicitation of an offer to buy or sell any security, financial product or instrument; or to participate in any particular trading strategy. It does not take into account readers’ financial situation or investment objectives. We advise any readers of this content to seek their own advice. Without the approval of Pepperstone, reproduction or redistribution of this information isn’t permitted.


