- English
- 中文版

In crude terms, we can summarise how market expectations for the fed funds rate have shifted this year in the following way:
- Jan/Feb: OIS > dots
- Early-Mar: OIS = dots
- Late-Mar/Early-Apr: OIS < dots
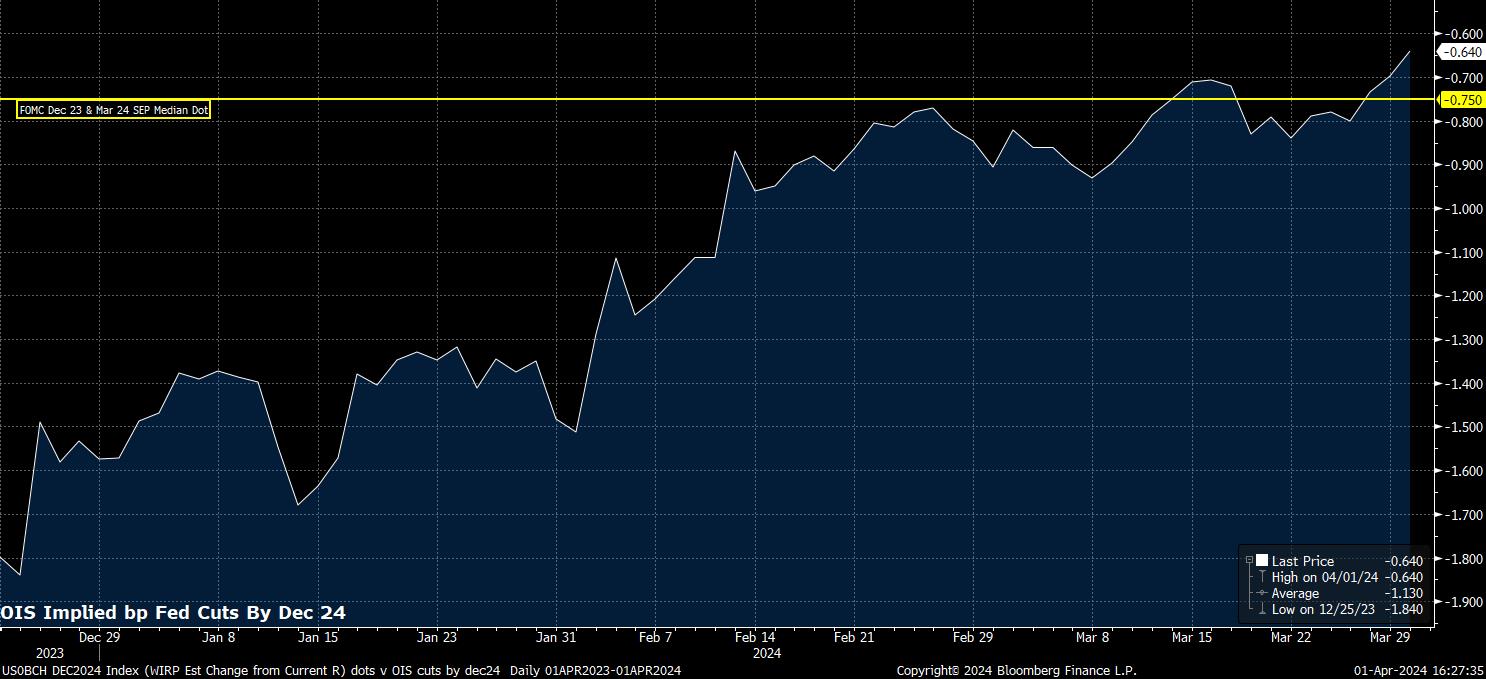
What does all that mean in something resembling English? Put simply, markets have moved from pricing as many as six 25bp cuts at the start of 2024, to now pricing fewer than three such rate reductions. In the process, this has seen the OIS curve shift from pricing an outlook substantially more aggressive than that signalled by the FOMC’s median dot – which has showed 75bp of cuts this year all along – to pricing one that is now a smidgen more hawkish than policymakers have signalled.
There are a number of reasons for this, though all bring us back to two key points – the economy has proved more resilient than expected, and inflation hasn’t fallen as rapidly as expected.
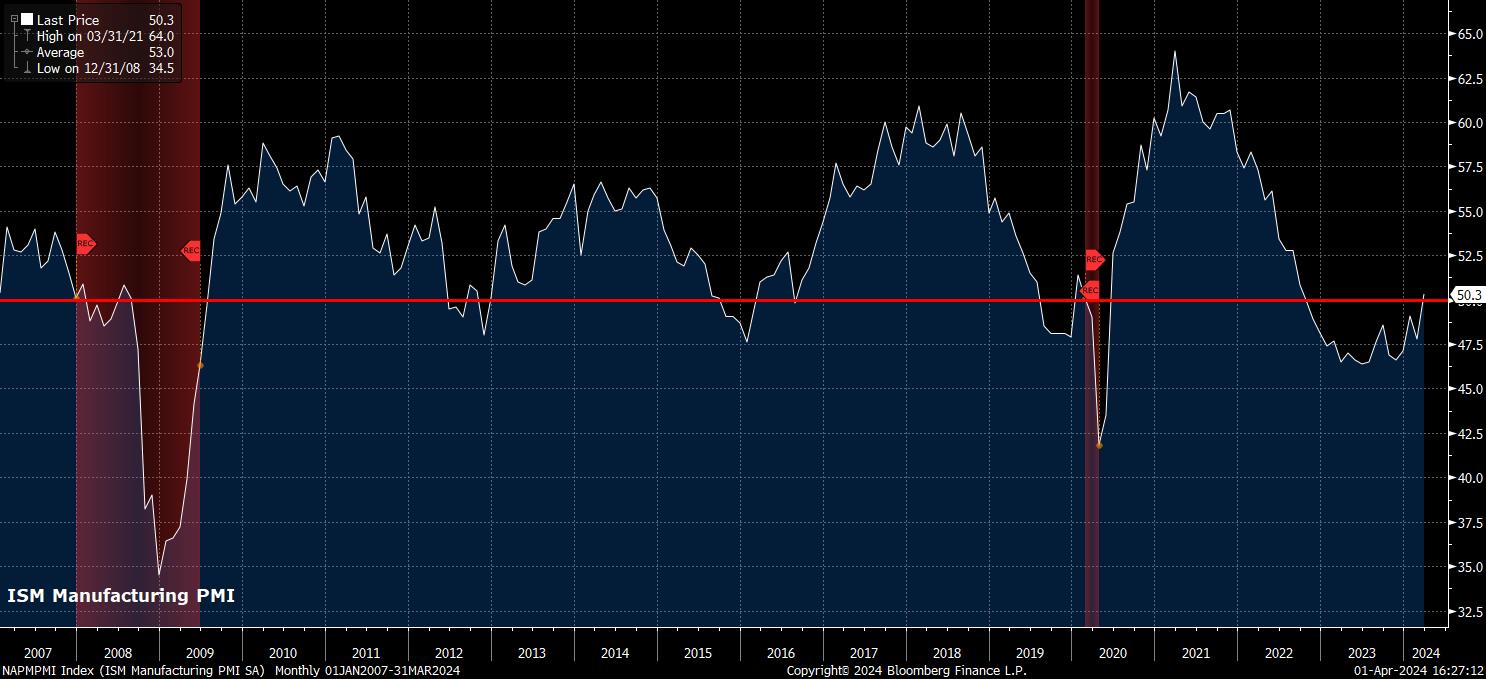
The March ISM manufacturing survey epitomises this well. At a headline level, the index rose north of the 50.0 breakeven mark between expansion and contraction last month for the first time since September 2022, surprising to the upside compared to all economist estimates in the process.
At the same time, the prices paid sub-index within the survey also rose, to 55.8, from a prior 52.5. This implies not only a quickening in the pace of price increases, within the manufacturing sector, but also represents the highest level for the prices paid measure since July 2022.
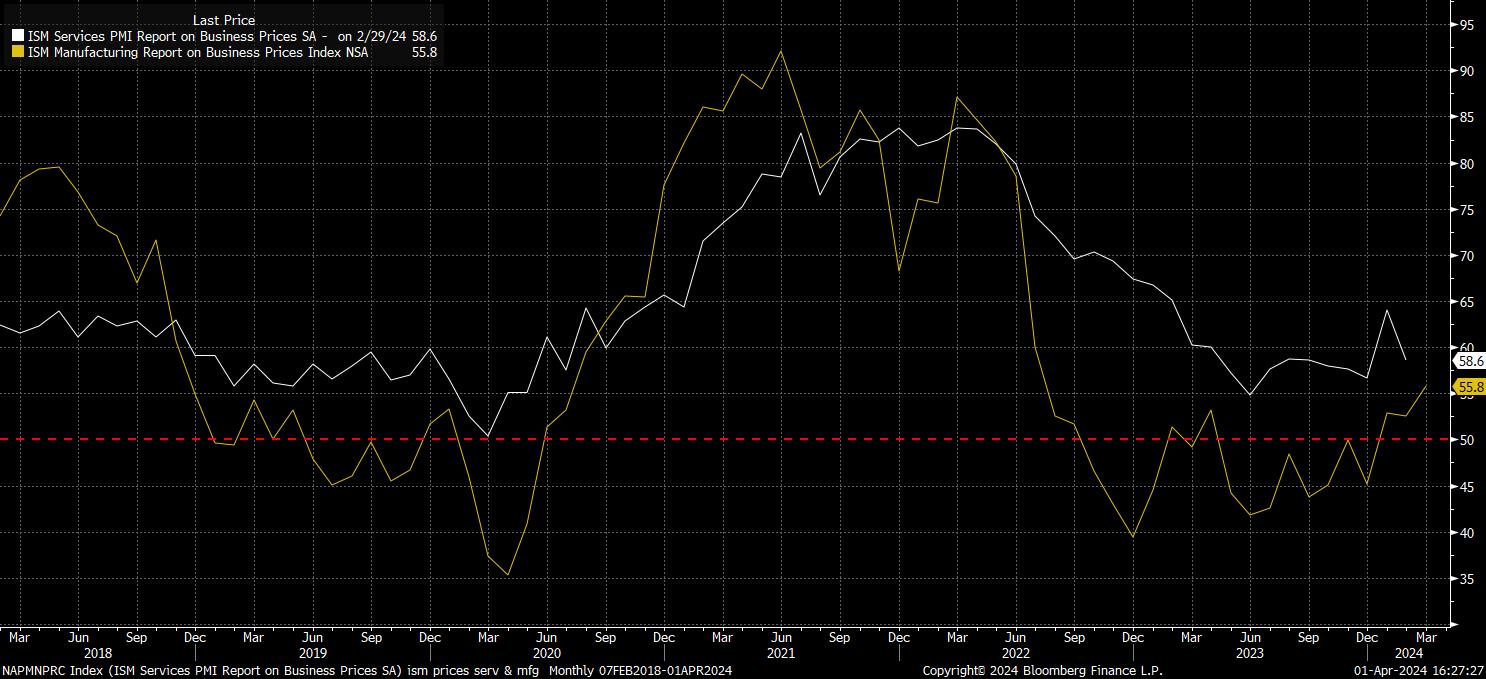
This latter point is particularly worrying, when one considers how the vast majority of the disinflation seen so far has been driven by the goods side of the economy, with services prices having remained stubbornly high. If we are now moving to a situation where goods inflation is re-accelerating, and services disinflation remains elusive, this will naturally push headline inflation measures higher. It has been, relatively, easy for policymakers to dismiss as noise hotter-than-expected January and February CPI prints, it will become much harder to dismiss a couple more months of similar data as noise, and much easier to call such data a trend.
This, then, brings back into sharp focus the ‘75bp vs. 50bp’ debate, of course pertaining to the degree of easing that the FOMC are likely to deliver this year. As the below chart shows, money markets are now split roughly 50/50 between either outcome, while OIS also prices the least amount of easing by year-end that it has done since the turn of the year.
Of course, this debate is a similarly close-run thing among FOMC members, with 10 policymakers seeing the year-end fed funds rate at or below a range of 4.5% - 4.75% (i.e., 75bp of cuts), and 9 seeing the fed funds rate above said range (i.e., implying less than 75bp of cuts).
Helpfully, the remainder of the week brings plenty that may help to clarify this debate – or, alternatively, to further muddy the waters. ISM services (Weds), and of course the March labour market report (Fri), now take on significantly greater importance, particularly if the former continues to signal stubbornly high services prices, and the latter once more points to a sizzling pace of job creation – headline NFP is currently seen +200k last month.
A veritable bonanza of Fed speakers also awaits, with 19 separate speeches due, including from Fed Chair Powell and NY Fed President Williams, though there does seem a real danger of over-communicating at this point. The ‘less is more’ philosophy is one that policymakers would do well to adopt at this point.
In any case, it is not particularly difficult to envisage a situation where, at the end of the week, we have a market pricing just 50bp of Fed cuts this year. If so, near-term risks tilt to the upside for the dollar, particularly as other G10 central banks lean in an increasingly dovish direction, and to the downside for both stocks and bonds, particularly at the front-end of the curve.
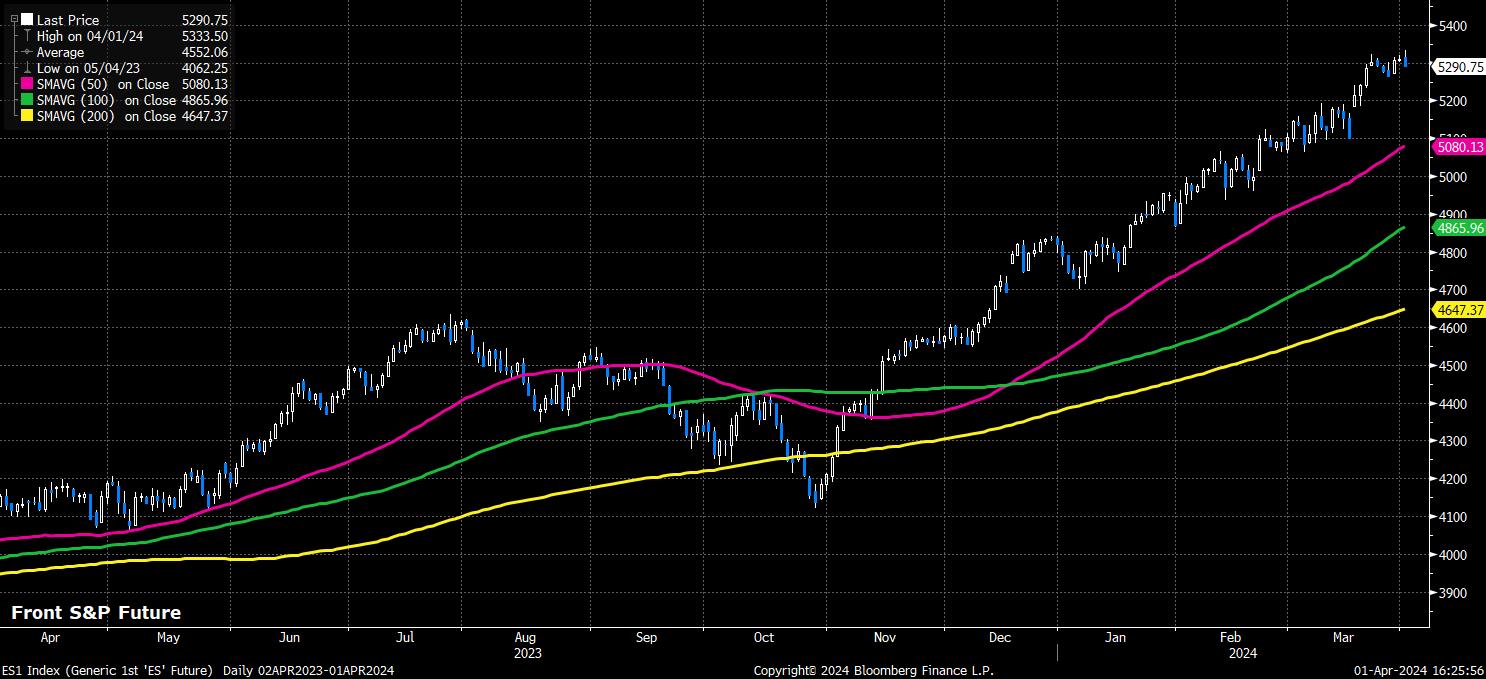
Equity downside, however, in my view should not be prolonged, or particularly extensive, with the policy outlook remaining a supportive one as the year progresses, and policymakers still possessing the optionality to deliver easing if it were required – the ‘Fed put’ is a powerful force, that one would be wise not to fight.
Hence, in terms of the S&P at least, the 50-day moving average, currently just shy of the 5.1k handle, is likely to be a region where buyers step in, if it were to be tested, with investors still comfortable in taking on risk, knowing that, no matter if this year brings 50bp or 75bp of cuts, the Fed have their backs once more.
Related articles

The material provided here has not been prepared in accordance with legal requirements designed to promote the independence of investment research and as such is considered to be a marketing communication. Whilst it is not subject to any prohibition on dealing ahead of the dissemination of investment research we will not seek to take any advantage before providing it to our clients. Pepperstone doesn’t represent that the material provided here is accurate, current or complete, and therefore shouldn’t be relied upon as such. The information, whether from a third party or not, isn’t to be considered as a recommendation; or an offer to buy or sell; or the solicitation of an offer to buy or sell any security, financial product or instrument; or to participate in any particular trading strategy. It does not take into account readers’ financial situation or investment objectives. We advise any readers of this content to seek their own advice. Without the approval of Pepperstone, reproduction or redistribution of this information isn’t permitted.