- English
- 中文版
A quantitative approach - Is Alibaba and Chinese big tech a buy?

Last week’s moves by China’s State Administration for Market Regulation may be seen by many as fair, but the measures increase the number of forceful and sustained regulatory curbs imposed by Chinese authorities in recent months.
As any investor will tell you, when you invest in a company with such monopolistic and strong price maker qualities, especially in a regime where there is a move to a “Common Prosperity”, regulation is always the biggest risk to sentiment. Certainly, any equity trader that has seen the incredible loss of market cap in Tencent, Alibaba (BABA), Baidu, and others will attest to that now.
Are we set to see a mean reversion rally?
The level of conversation around these names and whether the drop now represents a potential buying opportunity for long-term investors and traders has clearly ramped up. I would be fine with owning as a long-term play at current levels, but I've been most keen to explore whether after a 50% decline if there was a statistical trading case that suggested a short-term mean-reversion bounce is coming. I have paid particular focus on Alibaba (ticker: BABA).
Initially, I ran a scan of our complete universe of c.900 global equity CFDs for any 40% or more below the broker's consensus price target. I see 12 on the list, with BABA 42% below the consensus target price of $271 – I see the share CFDs trades on 17.7x full-year earnings and 14x 2022 earnings – if I didn’t believe BABA was due a raft of earnings downgrades, I’d argue this is insanely ‘cheap’, in fact, it’s never been lower but I rarely look at valuation for trading equity CFDs.
(Source: Bloomberg)
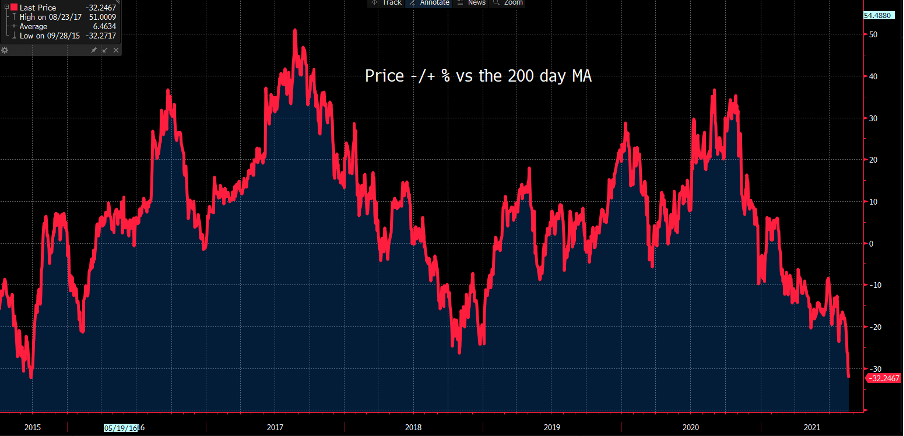
Perhaps more interestingly, having fallen 50% BABA is now one of only 9 US-listed share CFDs trading 30% or more below its 200-day moving average – It was 35% above the 200-day MA in October, now it resides at a record discount to the average. In fact, this is very close to 3 standard deviations from the 200-day moving average. The only time price has breached the 3 standard deviation band occurred once before in October 2018 and subsequently marked a bullish turning point, with the share CFDs rallying 29% over the coming 36 days.
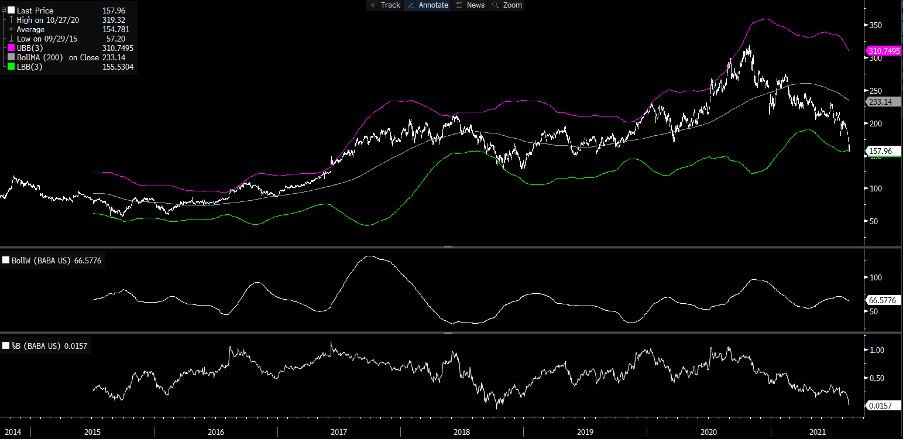
(Source: Bloomberg)
We can also see price close to the lower Keltner band – here, I've really stretched out the settings using a 20-day ATR length, 3 times ATR and 10-period average.
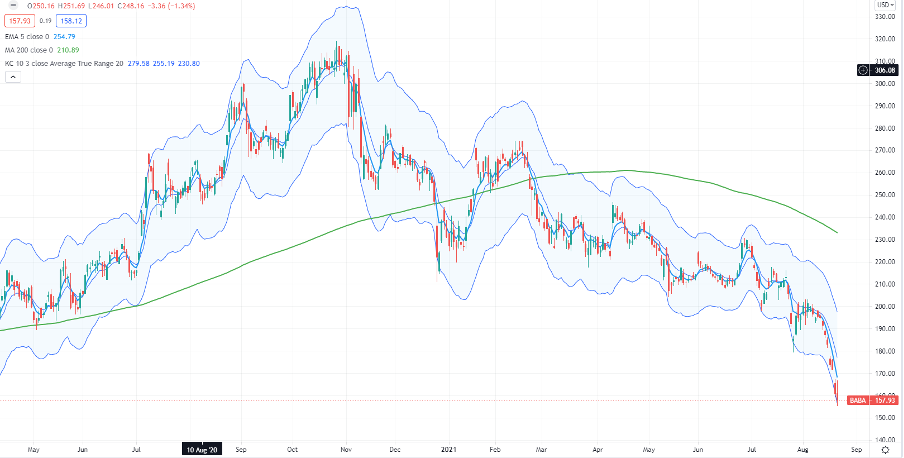
(Source: Tradingview)
I’ve then scanned for share CFDs in our full universe that have had a run of eight down days (or more) in a row and that have a 3-day RSI of less than 5 – of our 900 odd equity CFDs, I get BABA and Resolute Mining, in fact, the 3-day RSI on BABA is just 0.47.
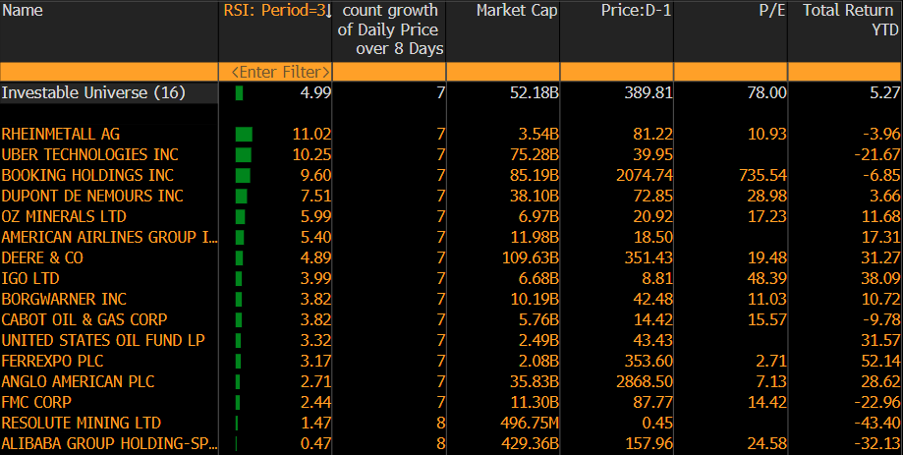
(Source: Bloomberg)
Crunching the numbers, I wanted to see if there was any kind of edge in buying BABA for a day after such a run of losses. Using the logic of buying on the open (after 8 down days) and selling (to close) on the open of the following day – since listing on the NYSE in 2014 the system would have placed 11 trades, which isn’t a huge sample size but there is a 73% winning ratio. The average loss is 1.32x higher than the average gain, so this works against performance, but the max win is 1.36x higher than the max loss.
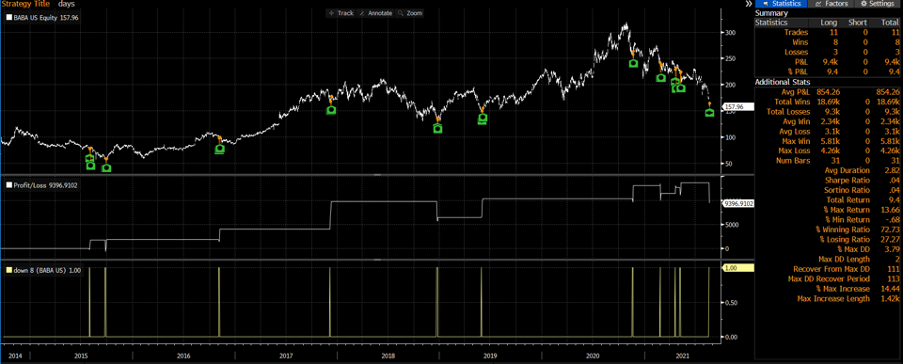
(Source: Bloomberg)
If I scan to see buying after eight consecutive falls with a 5-day hold period, my strike rate falls to 54%, but the average win is 1.35x that of my average loss. My max win is 1.8x my max loss.
I also see volume steadily rising in the sell-offs – where on Friday we saw 75m shares traded – the highest since 24 December…one questions if this is the capitulation move?
So the findings clearly show this name is incredibly oversold on many different technical and statistical readings. And that there is a small edge if one was to buy after this run of drawdown. One for the radar, as a bounce looks imminent even if it isn’t sustained. Trade the opportunity with Pepperstone today.
Related articles


Ready to trade?
It's quick and easy to get started. Apply in minutes with our simple application process.
The material provided here has not been prepared in accordance with legal requirements designed to promote the independence of investment research and as such is considered to be a marketing communication. Whilst it is not subject to any prohibition on dealing ahead of the dissemination of investment research we will not seek to take any advantage before providing it to our clients. Pepperstone doesn’t represent that the material provided here is accurate, current or complete, and therefore shouldn’t be relied upon as such. The information, whether from a third party or not, isn’t to be considered as a recommendation; or an offer to buy or sell; or the solicitation of an offer to buy or sell any security, financial product or instrument; or to participate in any particular trading strategy. It does not take into account readers’ financial situation or investment objectives. We advise any readers of this content to seek their own advice. Without the approval of Pepperstone, reproduction or redistribution of this information isn’t permitted.