- English
- Italiano
- Español
- Français
S&P 500 Weekly Forecast: Trading the Range Eyeing Support, Resistance, and Volatility Signals

This environment will evolve though and the current set-up may well prove to be the distribution phase of the cycle. It could also be the well needed consolidation phase with a bullish breakout taking the index to new all-time highs. As always, an open mind to where the market wants to go is critically important.
For now, consolidation is the play, and we can justify that call through multiple factors:
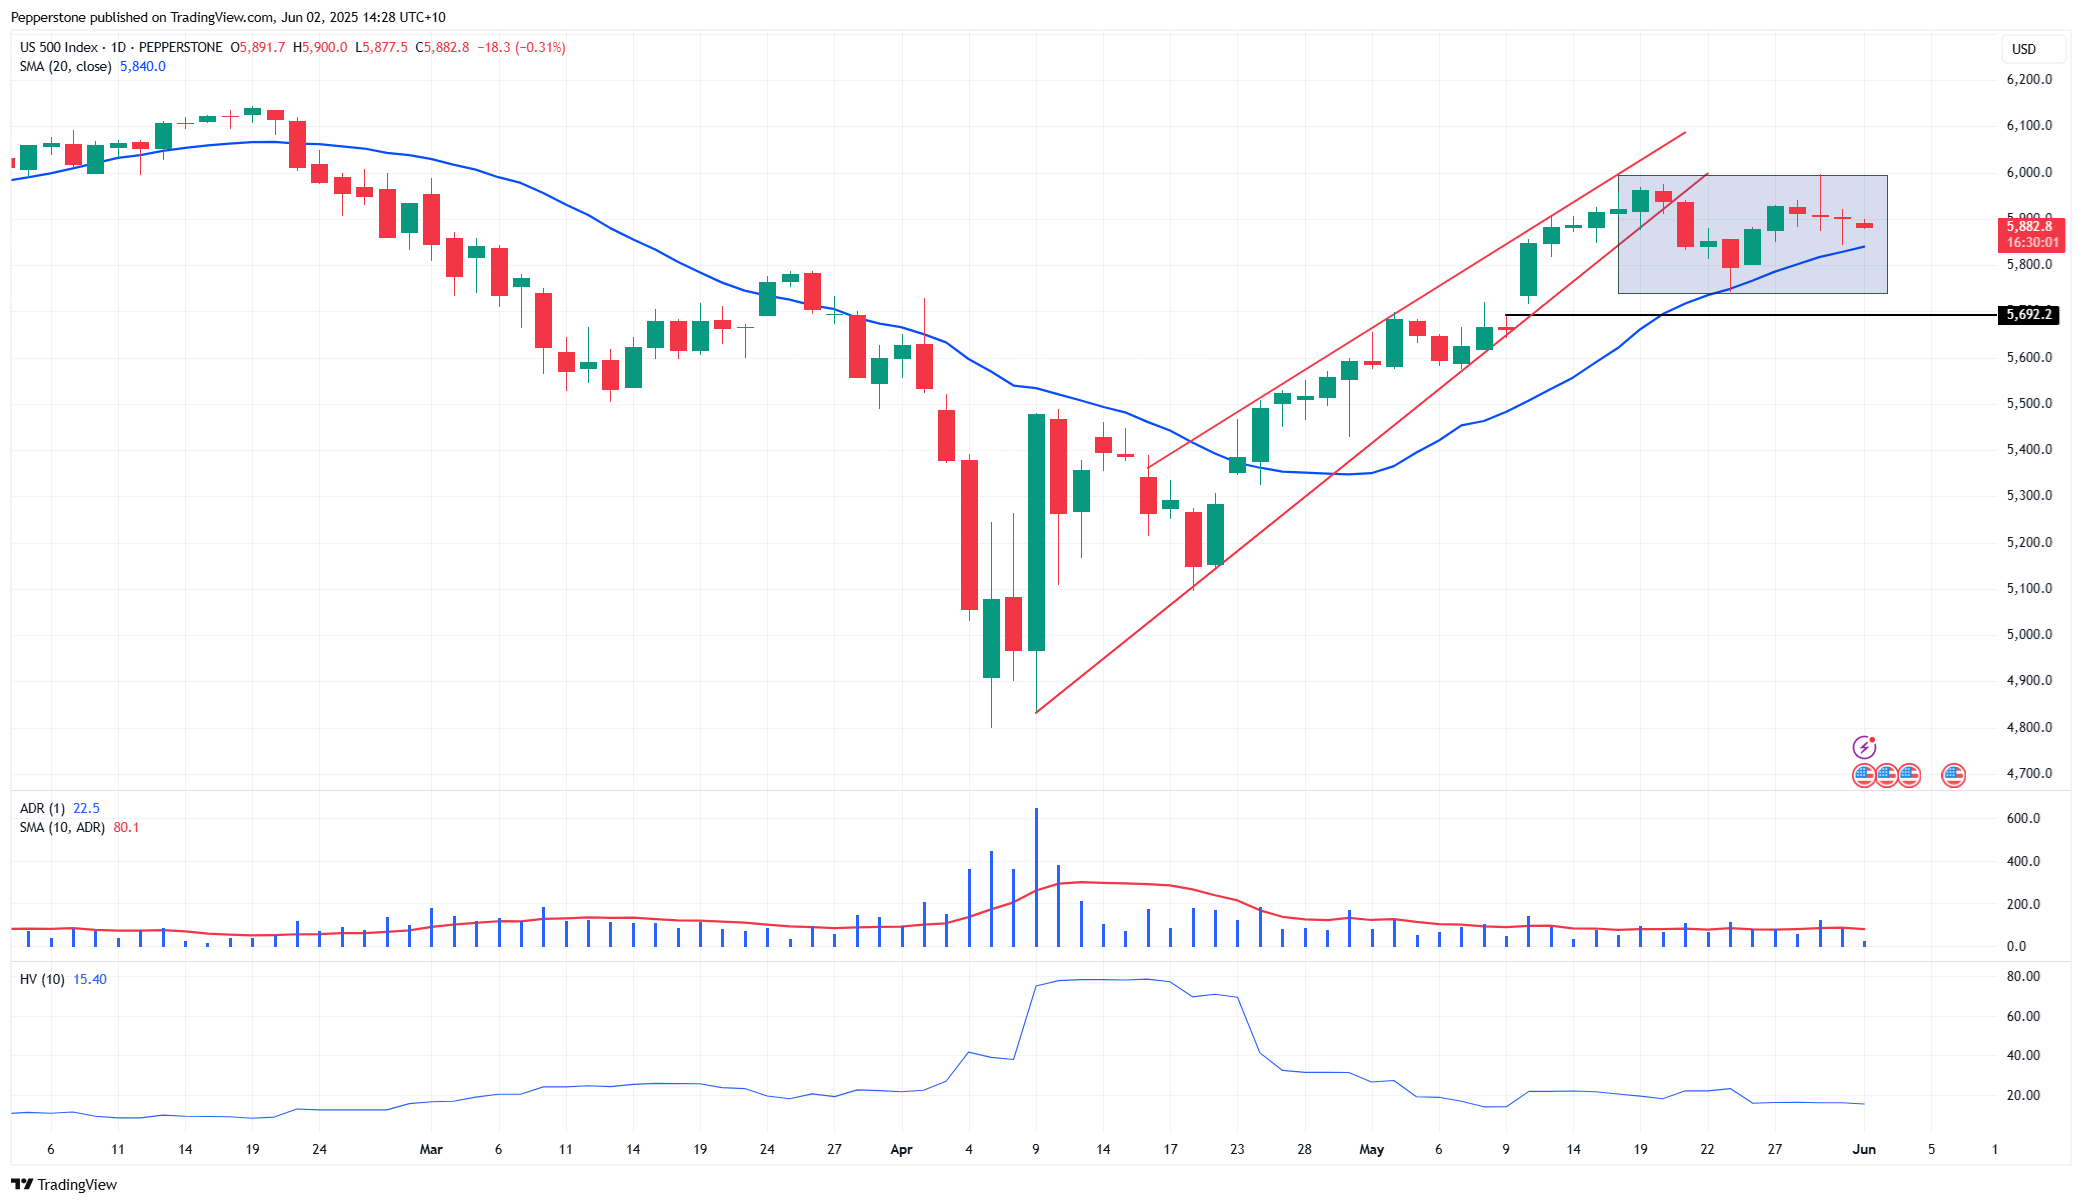
• The consolidation is clear on the daily timeframe, where we see the S&P500 range bound, with traders selling rallies into 6000, and buying into weakness below 5800.
• The 20-day MA (currently 5840) has contained the selling, and the fact it remains in an upward trajectory does offer some risk that the index may look to test 6000 soon. On the downside, the range low of 5741 (recorded on 23 May) is important and sets a lower limit for longs to mark their risk.
• In the last four trading sessions, the price action displays increased indecision from the collective to push price in a set direction, with consecutive doji candles printed on the daily timeframe.
• The daily high-low price ranges still offer plenty for the day traders to cut their craft within – however, the fact that the daily close-to-close percentage changes have been so well contained has resulted in S&P500 10-day realised volatility falling to 15.4%, below the 20th percentile of the 12-month range. Low volatility is typically a more optimal backdrop for intraday mean reversion strategies to operate effectively.
• We can also look at the level of implied volatility in S&P500 options pricing and see the VIX index at 18.57%, which is bang in line with the 12-month average. S&P500 1-week implied volatility trades at 17.45%, and while not far off the 12-month average is rising and likely reflects the impactful US data in play this week, with US nonfarm payrolls the marquee risk for traders navigate on Friday.
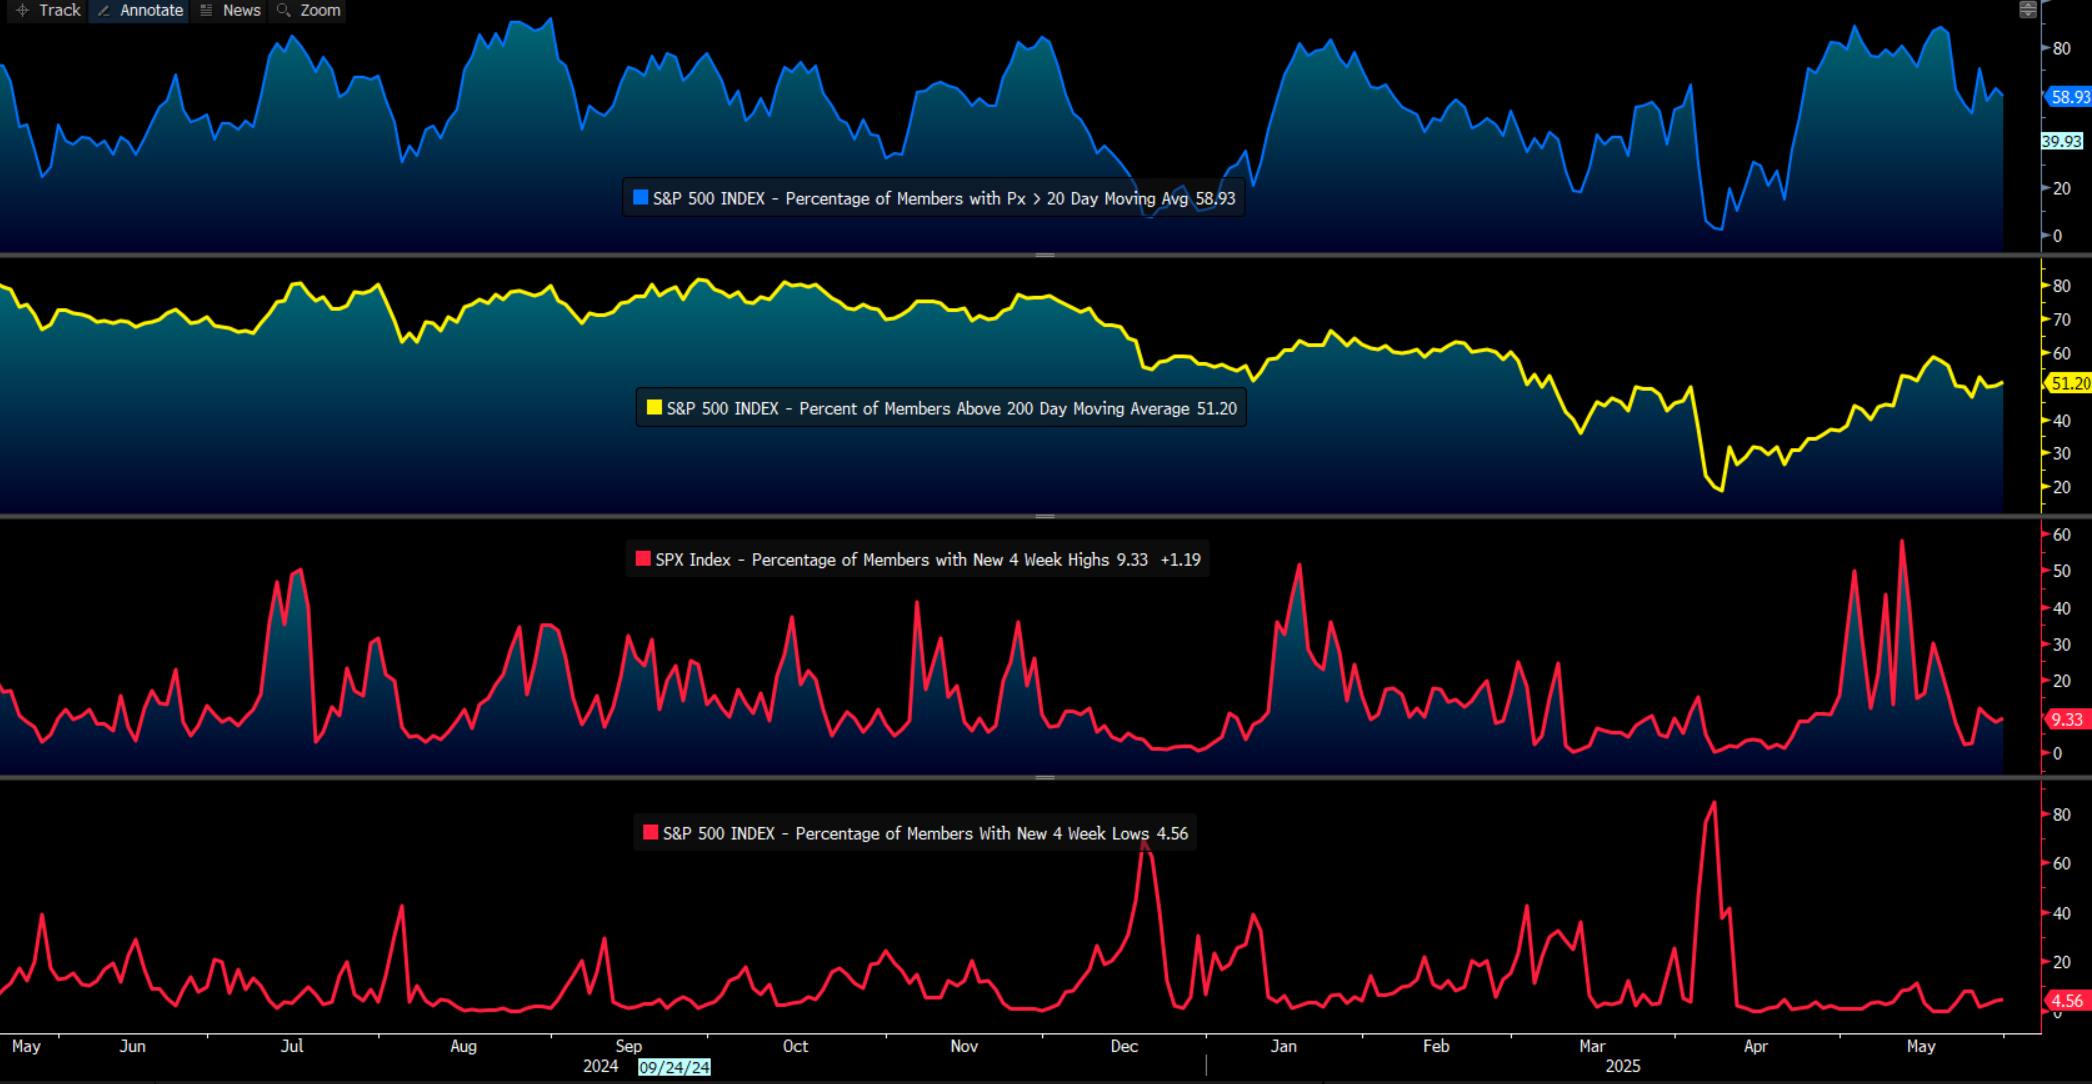
• The market internals are very balanced too (see the chart below) – 51% of S&P500 companies have a share price above their 200-day MA, with 58% above the 20-day MA.
• Looking at S&P500 sector performance over the past five trading sessions, we see that financials and energy have underperformed the S&P500, while REITS, utilities and staples have outperformed. Tech has been held up by a solid earnings report from Nvidia, while Microsoft has also supported.
• At the margin, the sectoral performance highlights a preference from investors to hang out in the low-volatility beneficiaries and high-income plays (for carry) while volatility is low and the index tracks in a sideways consolidation.
The event risk for traders to navigate this week
While it is likely traders will face the usual barrage of headlines surrounding the tariff saga, the risk this week comes from various US labour market data releases, notably Friday NFP print, with ISM manufacturing and services also getting some focus.
Bad news on the data front, despite it increasing the level of implied rate cuts from the Fed this year, should be taken as bad news for equity sentiment. Conversely, better-than-expected US economic data should result in equity appreciation.
For more intel on the event risks this week and how they could impact markets, see the ‘Traders’ Playbook'.
Earnings from Broadcom (Thursday after-market) may also get some attention, given they are the second largest AI-equity equity play.
In summary, traders will need to be cognisant of the risks/catalysts to markets from the US data flow this week – however, for now, the S&P500 and NAS100 have carved out a range, and that may be seen as an evolving distribution pattern – in which case watch for a relative increase in volume (in the S&P500 futures) on the down days. Typically the longer the consolidation the more powerful the breakout.
The material provided here has not been prepared in accordance with legal requirements designed to promote the independence of investment research and as such is considered to be a marketing communication. Whilst it is not subject to any prohibition on dealing ahead of the dissemination of investment research we will not seek to take any advantage before providing it to our clients. Pepperstone doesn’t represent that the material provided here is accurate, current or complete, and therefore shouldn’t be relied upon as such. The information, whether from a third party or not, isn’t to be considered as a recommendation; or an offer to buy or sell; or the solicitation of an offer to buy or sell any security, financial product or instrument; or to participate in any particular trading strategy. It does not take into account readers’ financial situation or investment objectives. We advise any readers of this content to seek their own advice. Without the approval of Pepperstone, reproduction or redistribution of this information isn’t permitted.