- English
- Italiano
- Español
- Français
- English
- Italiano
- Español
- Français
Analysis
S&P 500 Outlook: Further Gains Possible, But Watch These Key Support Levels

These positive fundamental factors marry well with the tailwinds that stem from increased corporate equity buybacks and a broad array of systematic and mechanical flows, with CTAs buyers of S&P 500 futures as the index rises above key buy trigger levels. Options dealers – who had recently been big sellers of call options – subsequently bought SPY ETFs, Nvidia and Tesla to adjust their deltas. While the further reduction in S&P 500 20-day realised volatility has also seen volatility-targeting funds increase both their US equity exposure and leverage within the portfolio.
The trading bias for the week ahead - 19 May 2025
The performance of the SPX has been wholly impressive - not just from absolute performance (the SPX has rallied 23% from the April low) – but also from the fact that in the past 15 trading sessions, we’ve only seen one day with the S&P 500 closing 1% lower. However, after this run, the daily chart is showing signs of exhaustion, with the buyers hesitating to push the index above 5900.
For now, I remain skewed and open-minded to the prospect of further upside and will remain so until price closes (daily timeframe) below both the 8-day EMA and the rising uptrend (drawn from the 9 April low).
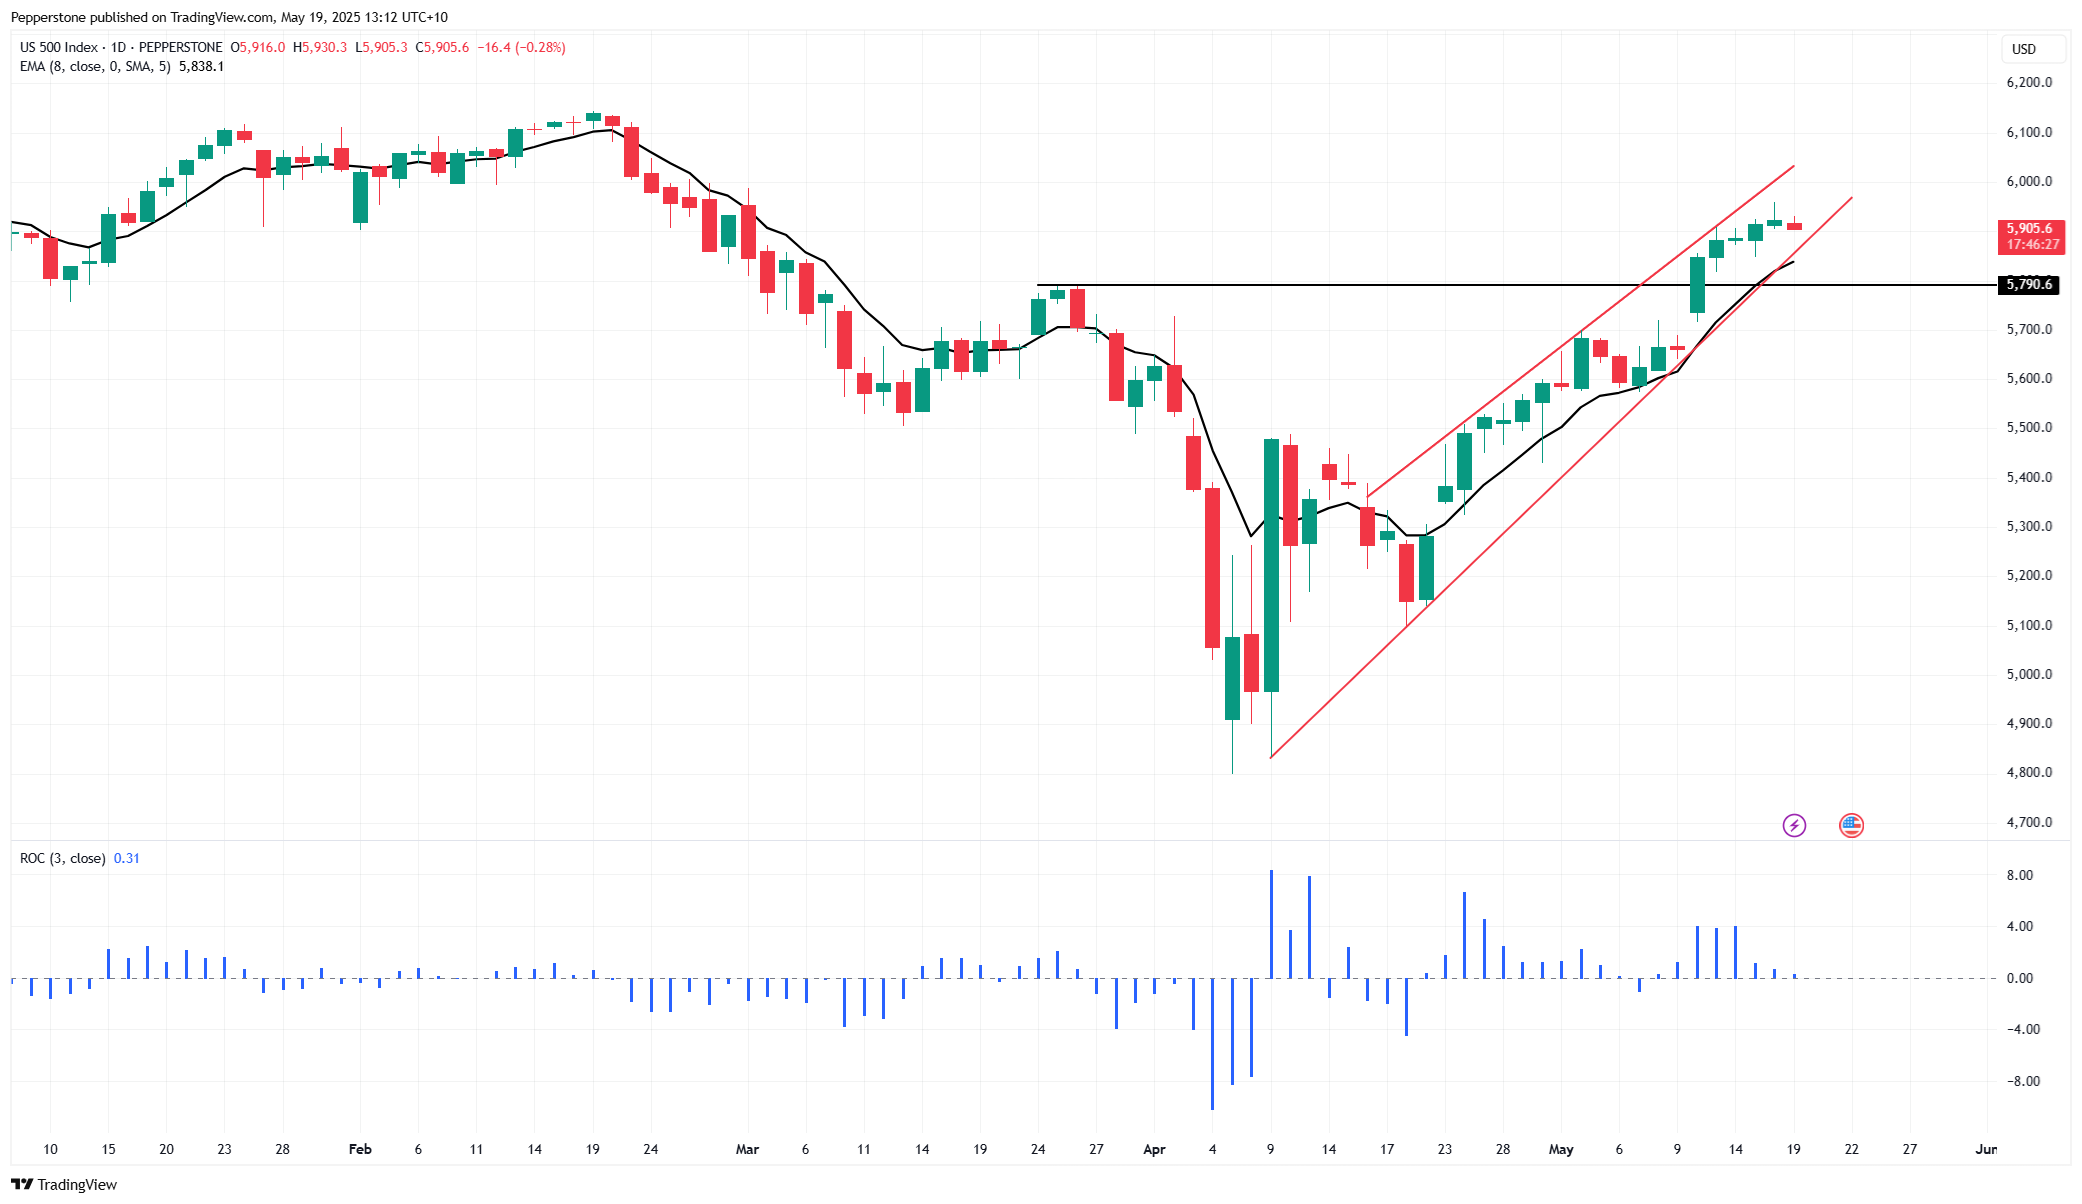
With the index seeing ever diminishing daily high-low trading ranges, we see the technical set-up forming a rising wedge pattern – again, until the index closes below the rising trend support, I am open to scenario that the index could push further higher and where an upside break of 5930 would see the index target 6000 and from there the ATH’s of 6144.
Assessing the trading environment
With the S&P 500 in a mature trending state, with lower volatility and range compression, the environment (for those trading on higher timeframes) has favoured long momentum and carry strategies.
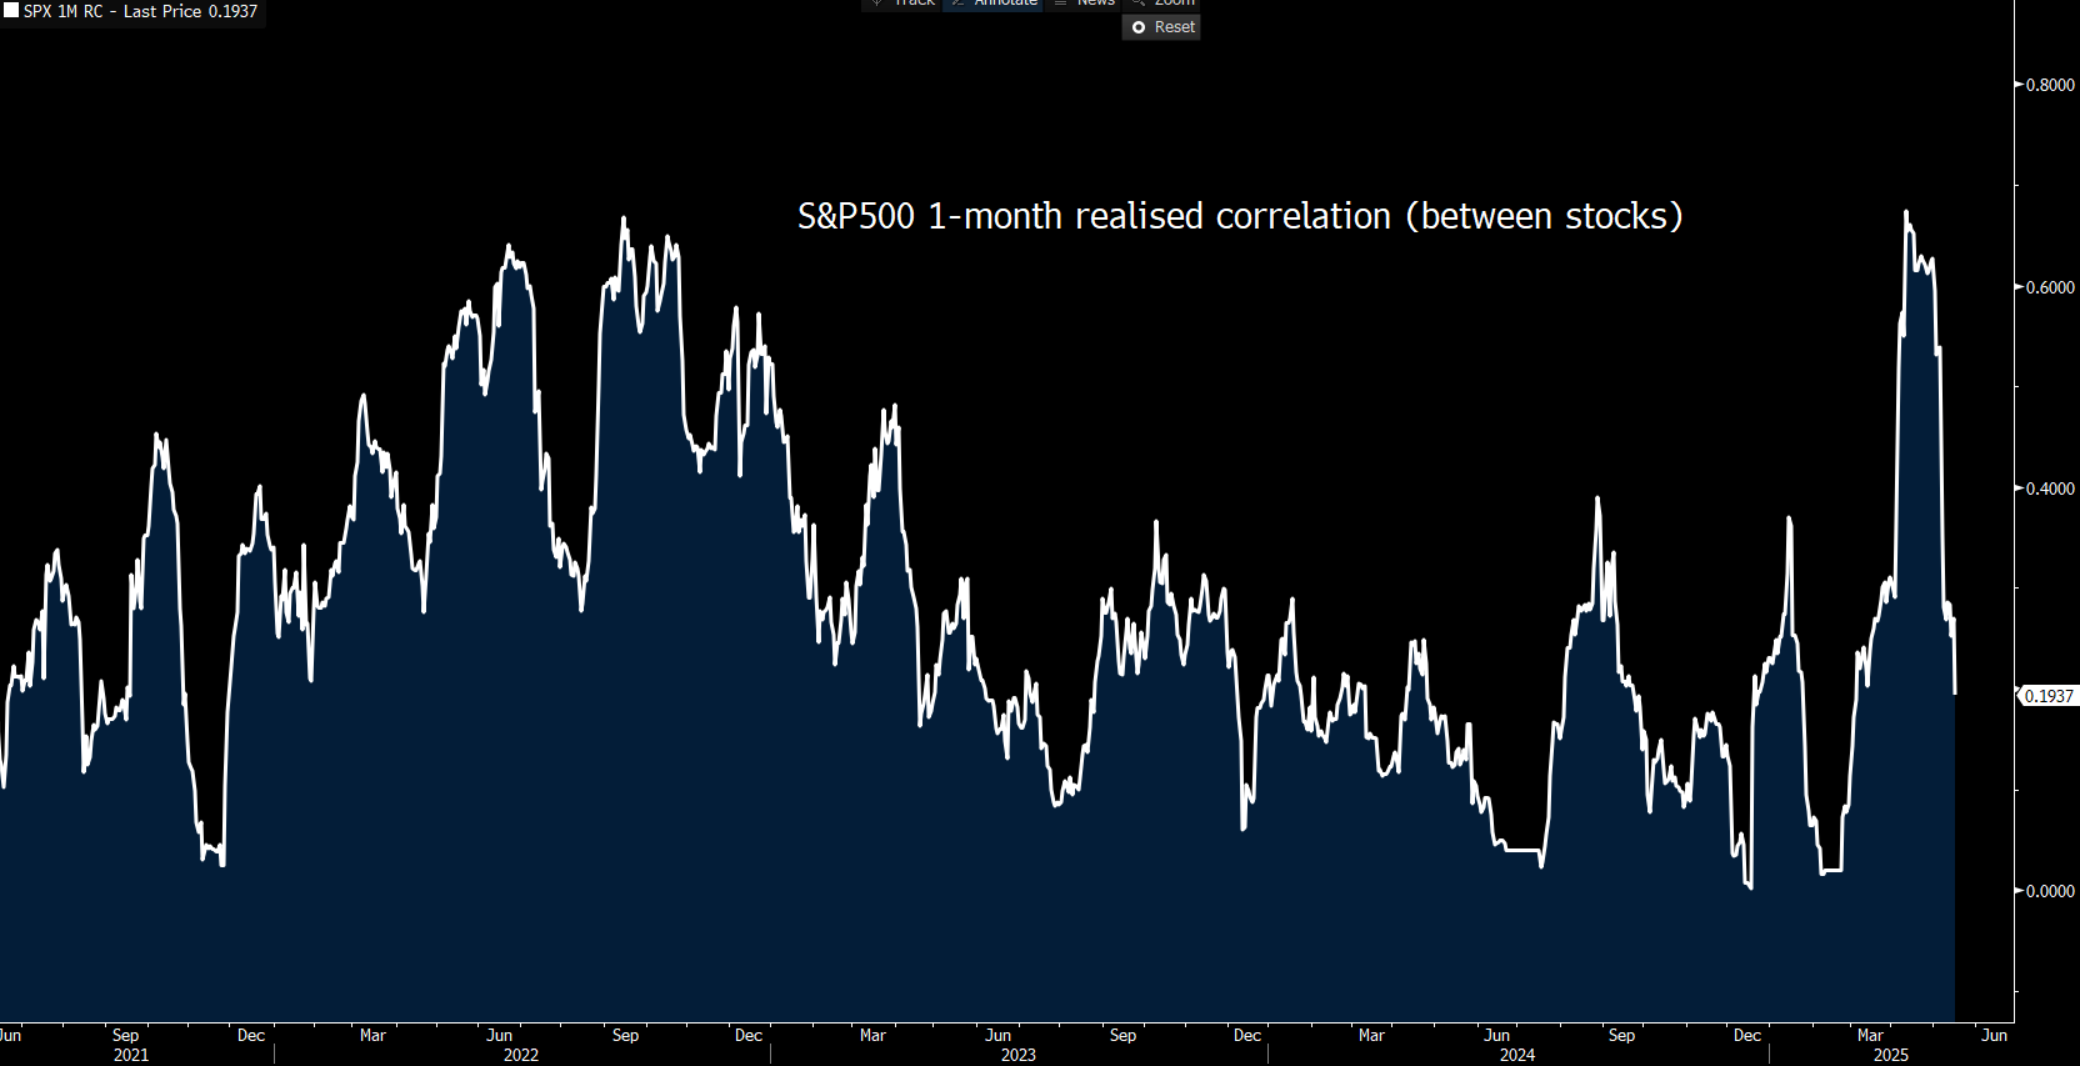
Statistical relationships between S&P 500 companies have broken down, with the 1-month realised correlation between S&P50 companies falling to 19% - the 28th percentile of the 12-month range. Lower correlations are not only indicative of reduced volatility but also highlight an improved environment for stock pickers, with recent investor flows headed towards high beta, high growth and cyclical equities.
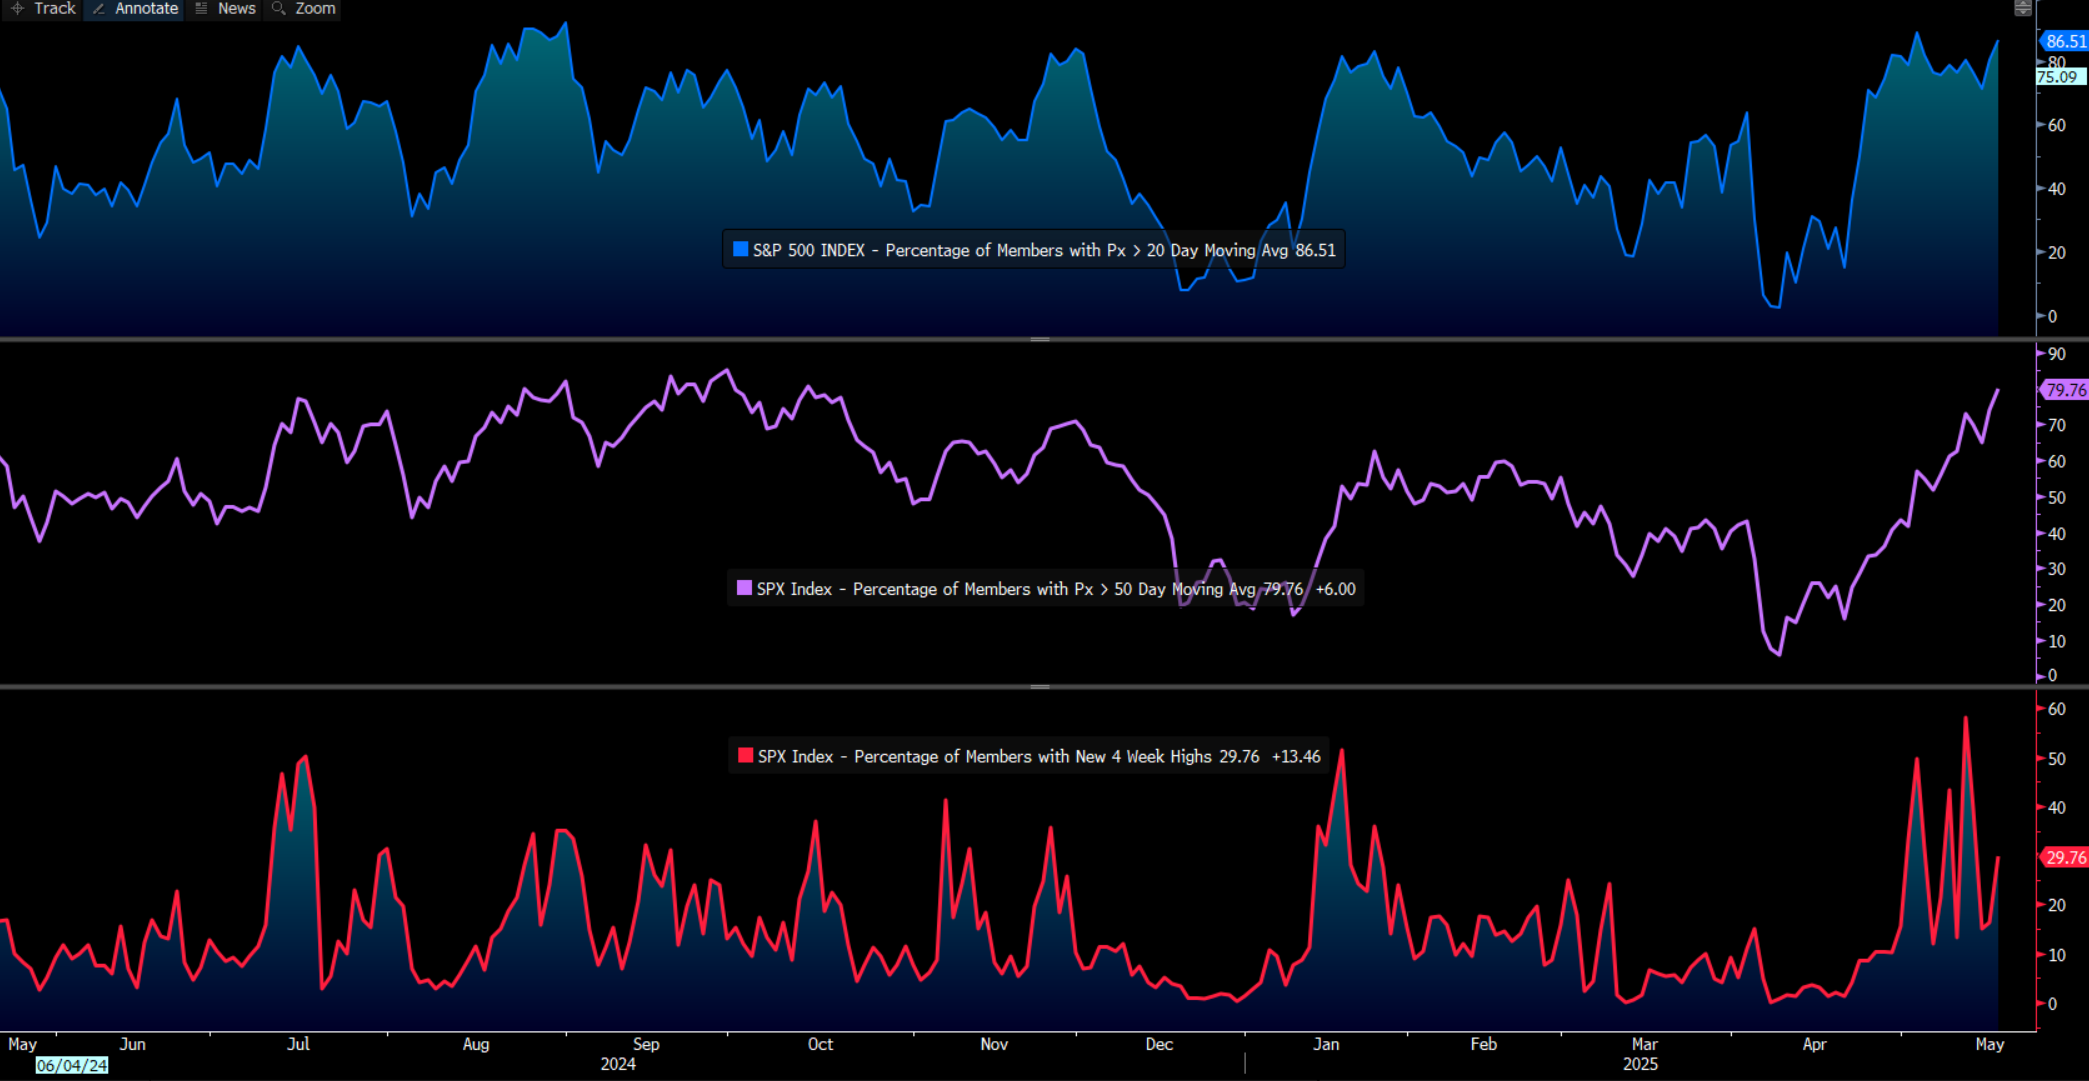
While US large-cap tech and consumer discretionary plays have outperformed, we see good participation in the rally, with 86% of S&P 500 companies now above the 20-day MA, a 10 ppt increase from last week. We also see 80% of S&P 500 companies above the 50-day MA, with 30% of companies closing at a 4-week high. One can view the market internals as a guide on the participation, while others may see the market internals as a contrarian indicator, with the current standing suggestive that we’re reaching the ‘Greed’ phase in the rally, with much of the good news in the price. We see that volumes in both the SPX cash and futures have been consistently in line with the 15-day average, and from here I will be watching for any marked increase in volumes on down days.
The risks to the S&P 500?
Earnings this week from Target and Home Depot will get focus from traders, and the guidance that these retailers offer on how they see the tariff landscape evolve and how they plan to manage their margins has the potential to impact the broad index. The US fiscal also gets increased attention with Trump looking to pass his tax policy through the House – a factor that has many considering future deficit levels and how this translates into higher Treasury supply and ultimately US Treasury pricing.
With yields across the Treasury curve pushing range highs, a further push higher could start to weigh more on the equity market, although it’s the rate of change (in yield) that matters most to equity valuation.
Often the biggest factor that could compel further upside or an increased bout of profit taking is price itself - and with market players having aggressively covered shorts, running down portfolio hedges and amassing a reasonable long position in high beta equity and S&P 500 futures, if the S&P 500 rolls over and breaks trend support that in itself could lead to other players reducing their equity exposure.
For a more thorough overview of the event risks for the week ahead, see our 'Traders' Playbook'.
So, in summary, I remain with a long bias for the S&P 500 but will be guided by the price action and technicals and would reassess as and when price breaks below these triggers.
Good luck to all.
The material provided here has not been prepared in accordance with legal requirements designed to promote the independence of investment research and as such is considered to be a marketing communication. Whilst it is not subject to any prohibition on dealing ahead of the dissemination of investment research we will not seek to take any advantage before providing it to our clients. Pepperstone doesn’t represent that the material provided here is accurate, current or complete, and therefore shouldn’t be relied upon as such. The information, whether from a third party or not, isn’t to be considered as a recommendation; or an offer to buy or sell; or the solicitation of an offer to buy or sell any security, financial product or instrument; or to participate in any particular trading strategy. It does not take into account readers’ financial situation or investment objectives. We advise any readers of this content to seek their own advice. Without the approval of Pepperstone, reproduction or redistribution of this information isn’t permitted.