Spread bets and CFDs are complex instruments and come with a high risk of losing money rapidly due to leverage. 72% of retail investor accounts lose money when trading spread bets and CFDs with this provider. You should consider whether you understand how spread bets and CFDs work, and whether you can afford to take the high risk of losing your money.
- English (UK)
How technical and price action analysis can help traders through the US election

Making the right connections to the financial markets requires an understanding of the policies of both the Democratic (DEM) and Republican (REP) parties, and importantly which of these policies the market sees as the most impactful, either on the economy or on corporate profitability.
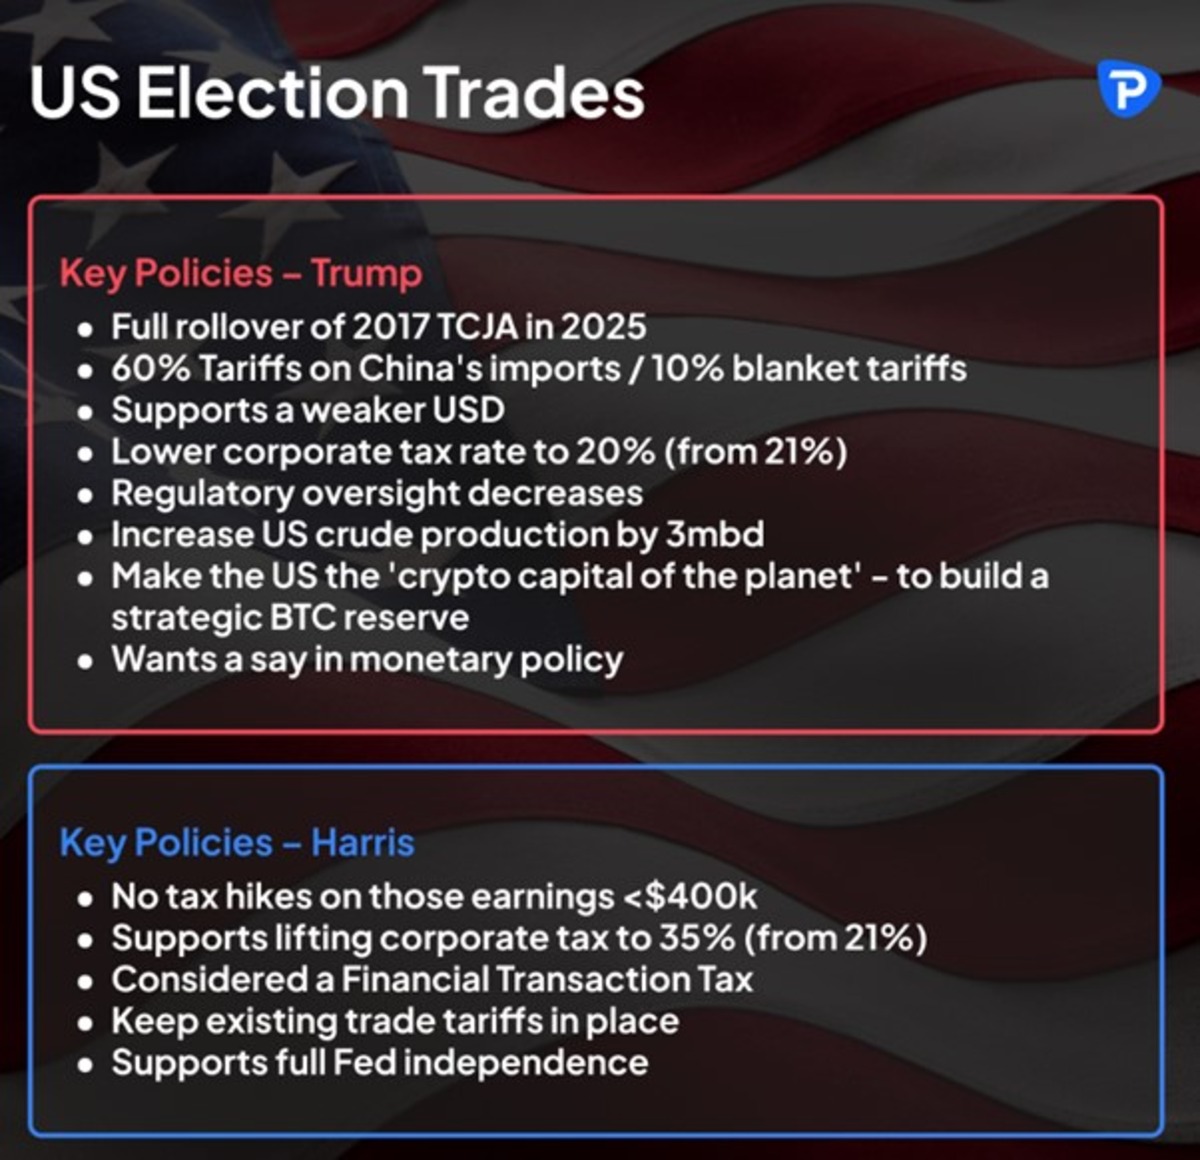
Marquee market moving policies – Trump vs Harris

Finding the optimal time to express election trades
Traders then need to consider the most optimal time to express trades centred on the US election. If the US election is still many weeks away and geopolitical tensions rise, or we see US economic data truly deteriorate, then markets may reduce all sensitivity towards potential election outcomes, and market direction will come from these other sentiment-changing factors.
Subsequently, the best time to express a view on the US election is when the news flow becomes the absolute focus of markets – where headlines noticeably drive price action, and we see US election news consistently as the headline article. It’s here where markets will show a limited reaction to economic data release (such as the US non-farm payrolls or US CPI) and myopically attempt to price potential changes to fiscal policy, trade and international relations, and industry regulation should the polls indicate a lead for either Trump or Harris.
The current composition (Dems vs Reps) in the House and Senate
.jpg)
To make matters more complex, it’s not just who becomes President that could move markets – but the make-up of Congress could be hugely influential on market pricing too. If the elected President can’t pass the more contentious policies using executive orders and we see the DEMs take the House and the REPs the Senate, then a ‘split Congress’ will likely lead to gridlock. Subsequently, any reaction that could move a market from a specific policy will be far less empathetic.
In a split congress, traders should consider which policies won’t pass in the current proposed form, while also considering which policies are simply campaign rhetoric. For example, Trump has suggested that he wants a say in the setting of monetary policy. The reality is that a loss of Fed independence would likely lead to a market meltdown, which, therefore, makes this proposal unlikely to play out.
Thinking about how the broad market will interpret news
Perhaps, the most important consideration when placing tactical election trades is not necessarily about how you interrupt a change in the polls and the probabilities of an election outcome. But how the collective view of all market participants sees these changes impacting the election, which, in turn, impacts market sentiment and pricing.
Should we hypothetically see Trump pull ahead in the national polls, I may consider buying USDCNH (Chinese yuan) due to his proposed 60% tariff on Chinese imports. However, if most market participants decide to sell USDCNH because they are more concerned with the Trump/Vance preference for a weaker USD, or Trump’s desire to have a say on monetary policy, then my trade might be at odds with the collective weight of money and the directional flow at that time.
My view on the connection between a political outcome and the impact on a market is irrelevant if the broad weight of capital doesn’t share that same view – I might ultimately be correct in the end, but if USDCNH trades lower, I’m now managing a losing position.
Why technical analysis and/or a study of price action can simplify this process
Where technical (TA) and price action (PA) analysis can be powerful as a method of trading the US election is to see it as a roadmap of all aggregated supply and demand, and importantly how the broad collective interprets the news flow. In most forms, neither TA nor PA is there to predict the future, but it helps shape our assessment of the probability of a directional move.

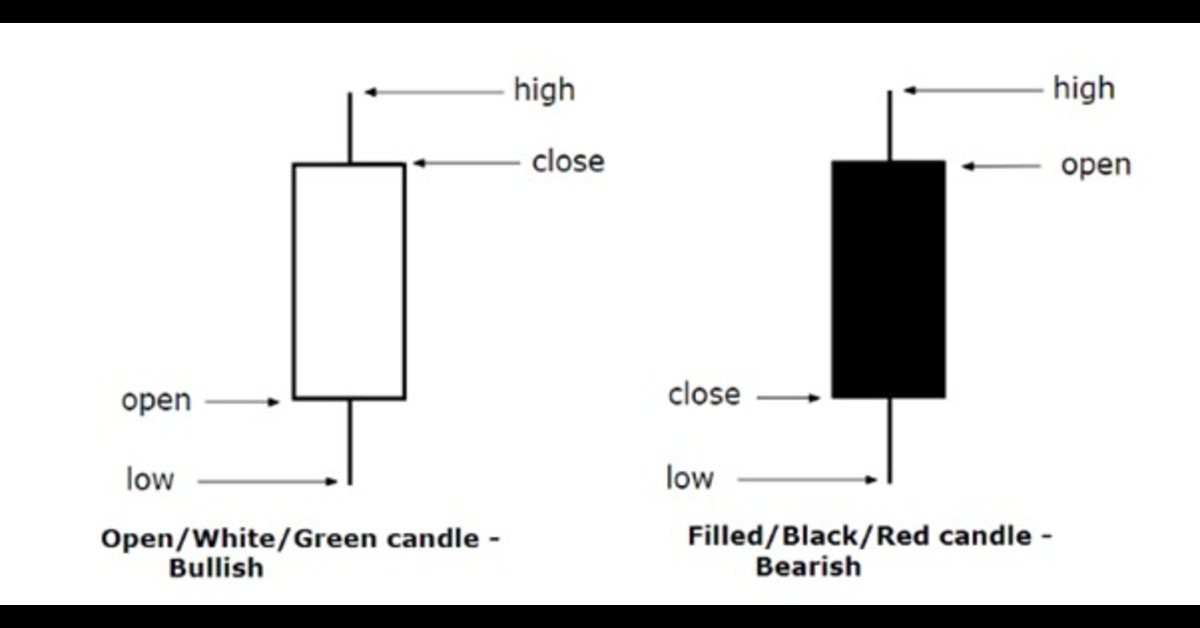
For more information on reading price action through candlesticks read our trading guide
Traders don’t need to be well-versed in the keynote policies that each presidential candidate stands for – they observe how the market believes the election is playing out at that moment in time. It allows us to observe if there is truly an actionable signal to be had from a highly surprising poll, or if Trump or Harris has said something that traders feel will impress/upset the voters.
Technical analysis looks for repeatable behaviours
In many technical analysis strategies, traders look for repeatable patterns and behaviours that offer a high probability that that action could play out again. Of course, as new news becomes known in the market then the conditions may change, and trends may reverse. However, by reacting to the flow of all capital the result can help us create strategies that increase our probabilities in a trade and that offer an edge.
There is also a strong risk management element that TA and PA can solve. Traders can use various technical indicators to quantify movement in a market (such as the NAS100, gold or the USD). This can help traders understand the optimal level of risk to be taken in a trade (i.e. the distance to our stop loss) and subsequently help achieve the correct position size, relative to the volatility in the market at that time.
The bottom line is that for many in the market the US election will be fascinating to view. However, trying to make money from this event takes skill, knowledge and an element of luck. By aligning with the collective wisdom in the market, you don’t necessarily need to follow the polls or correctly interpret how a speech from Trump or Harris has resonated with the American voting public.
Learn to see the charts as a roadmap and think about the future in probabilities. Technical and/or price action analysis, when built into a robust framework and process can help cut through the noise and the emotion that comes with such a polarizing event.
Pepperstone - offering cutting edge charting solutions
Why not look at Pepperstone’s cutting-edge charting packages, trading tools, and EAs through our extensive range of trading platforms and on mobile.
The material provided here has not been prepared in accordance with legal requirements designed to promote the independence of investment research and as such is considered to be a marketing communication. Whilst it is not subject to any prohibition on dealing ahead of the dissemination of investment research we will not seek to take any advantage before providing it to our clients. Pepperstone doesn’t represent that the material provided here is accurate, current or complete, and therefore shouldn’t be relied upon as such. The information, whether from a third party or not, isn’t to be considered as a recommendation; or an offer to buy or sell; or the solicitation of an offer to buy or sell any security, financial product or instrument; or to participate in any particular trading strategy. It does not take into account readers’ financial situation or investment objectives. We advise any readers of this content to seek their own advice. Without the approval of Pepperstone, reproduction or redistribution of this information isn’t permitted.