- Español
- English
- Italiano
- Français
Let us first look at the peaks
Before we look at the latest Bitcoin crash, let us look at the price action since the birth of the major cryptocurrency. We are going to break down the move using the Elliott Wave theory and chart patterns.
If we look at the weekly timeframe, we can see some of the characteristics of Elliott Wave. This is a five-wave impulsive move to the upside, with a pause in the rally close to the 161.8% extension, forming the 4th wave.
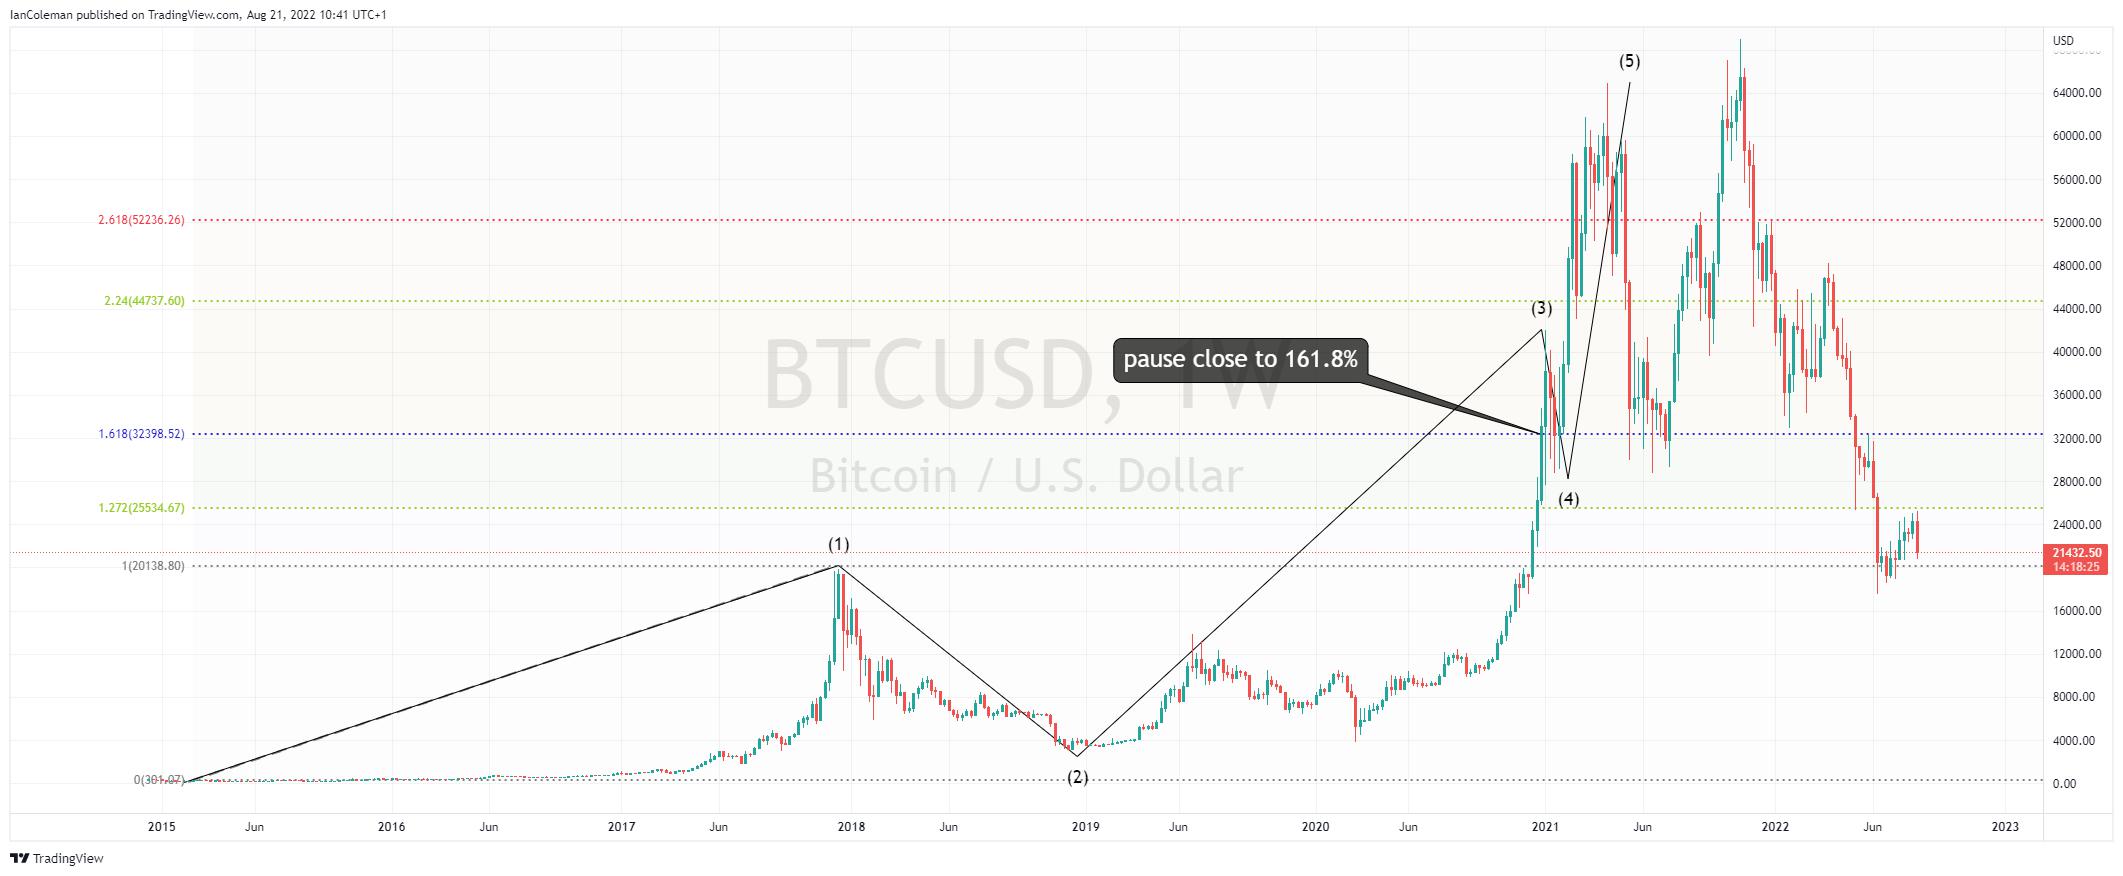
Figure 1 Trading View BTCUSD weekly Elliott Wave
What is out of character for Elliott Wave is the fact that BTCUSD then made a new swing high in November 2021. We say ‘out of character’ as Elliott Wave still allows the overshoot, calling this a 5th wave extension.
Characteristics of the turning points
Now have the possible Elliott Wave theory, what are the characteristics of the Bitcoin crashes?
The turning points have been highlighted with solid reversal candle formations. The weekly chart highlights bearish and bullish Outside Bars and an Evening Doji Star at the latest swing high.
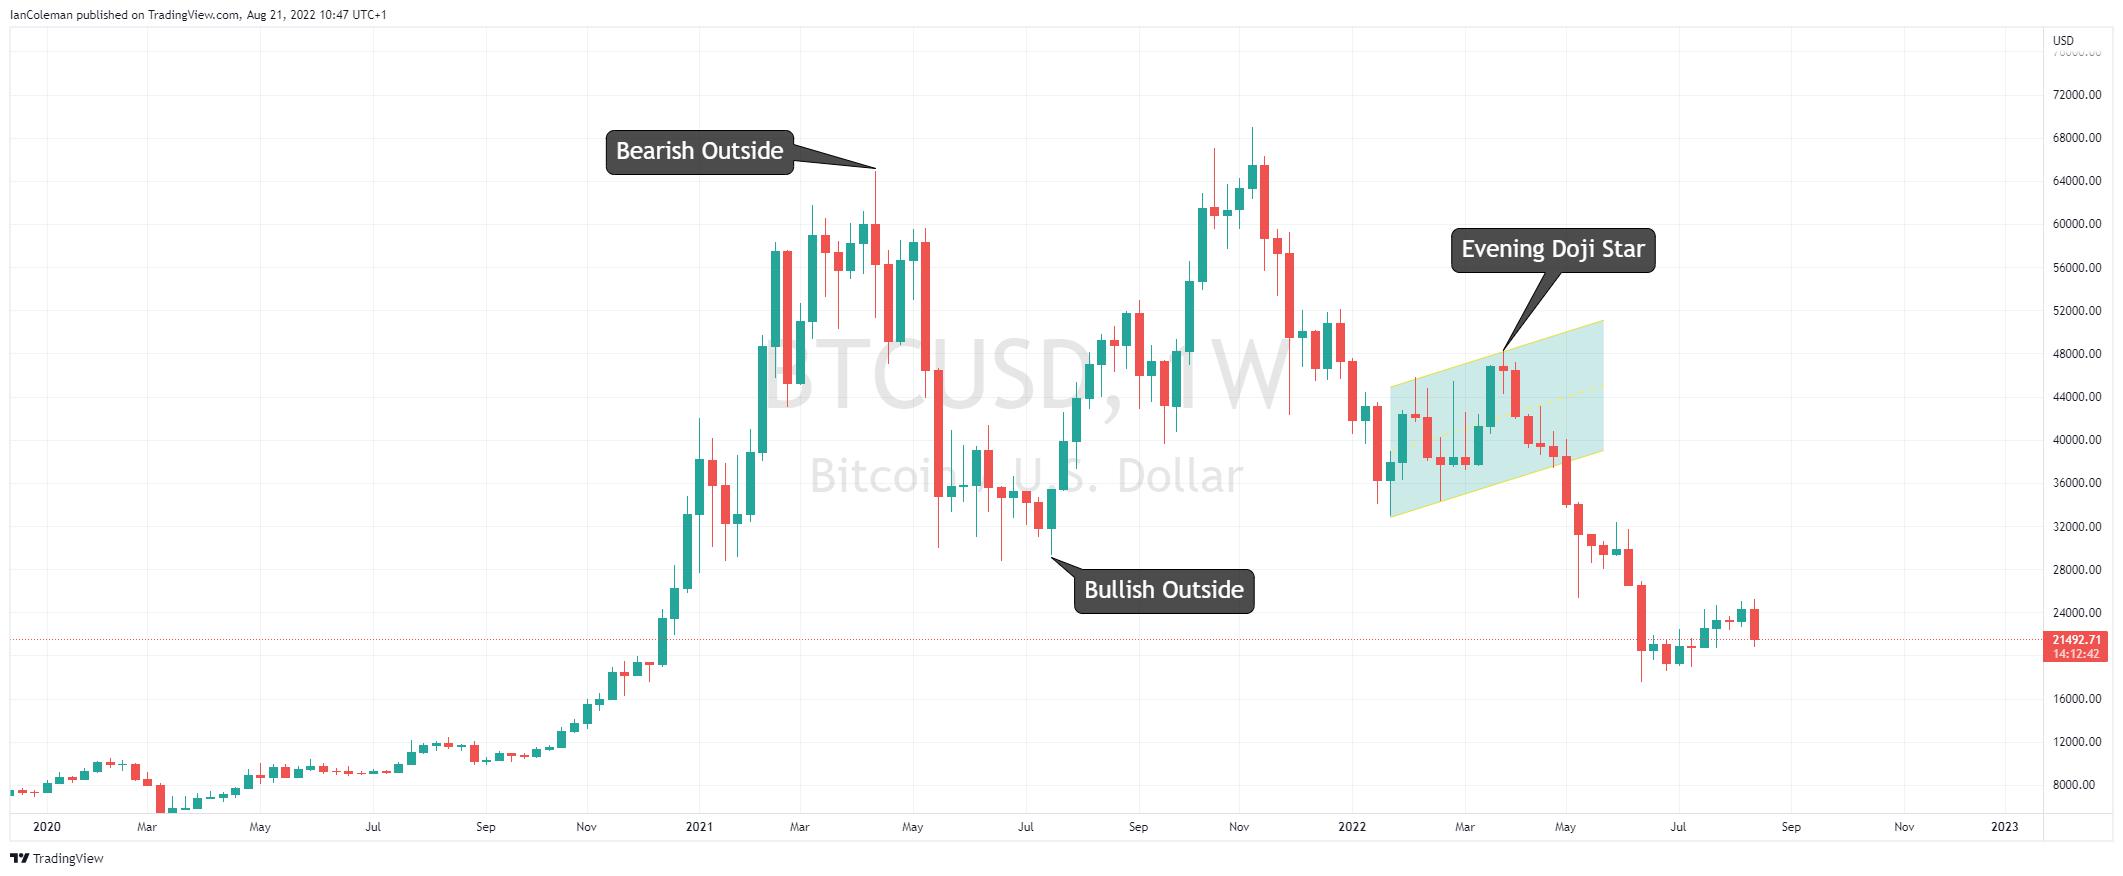
Figure 1 Trading View turning points
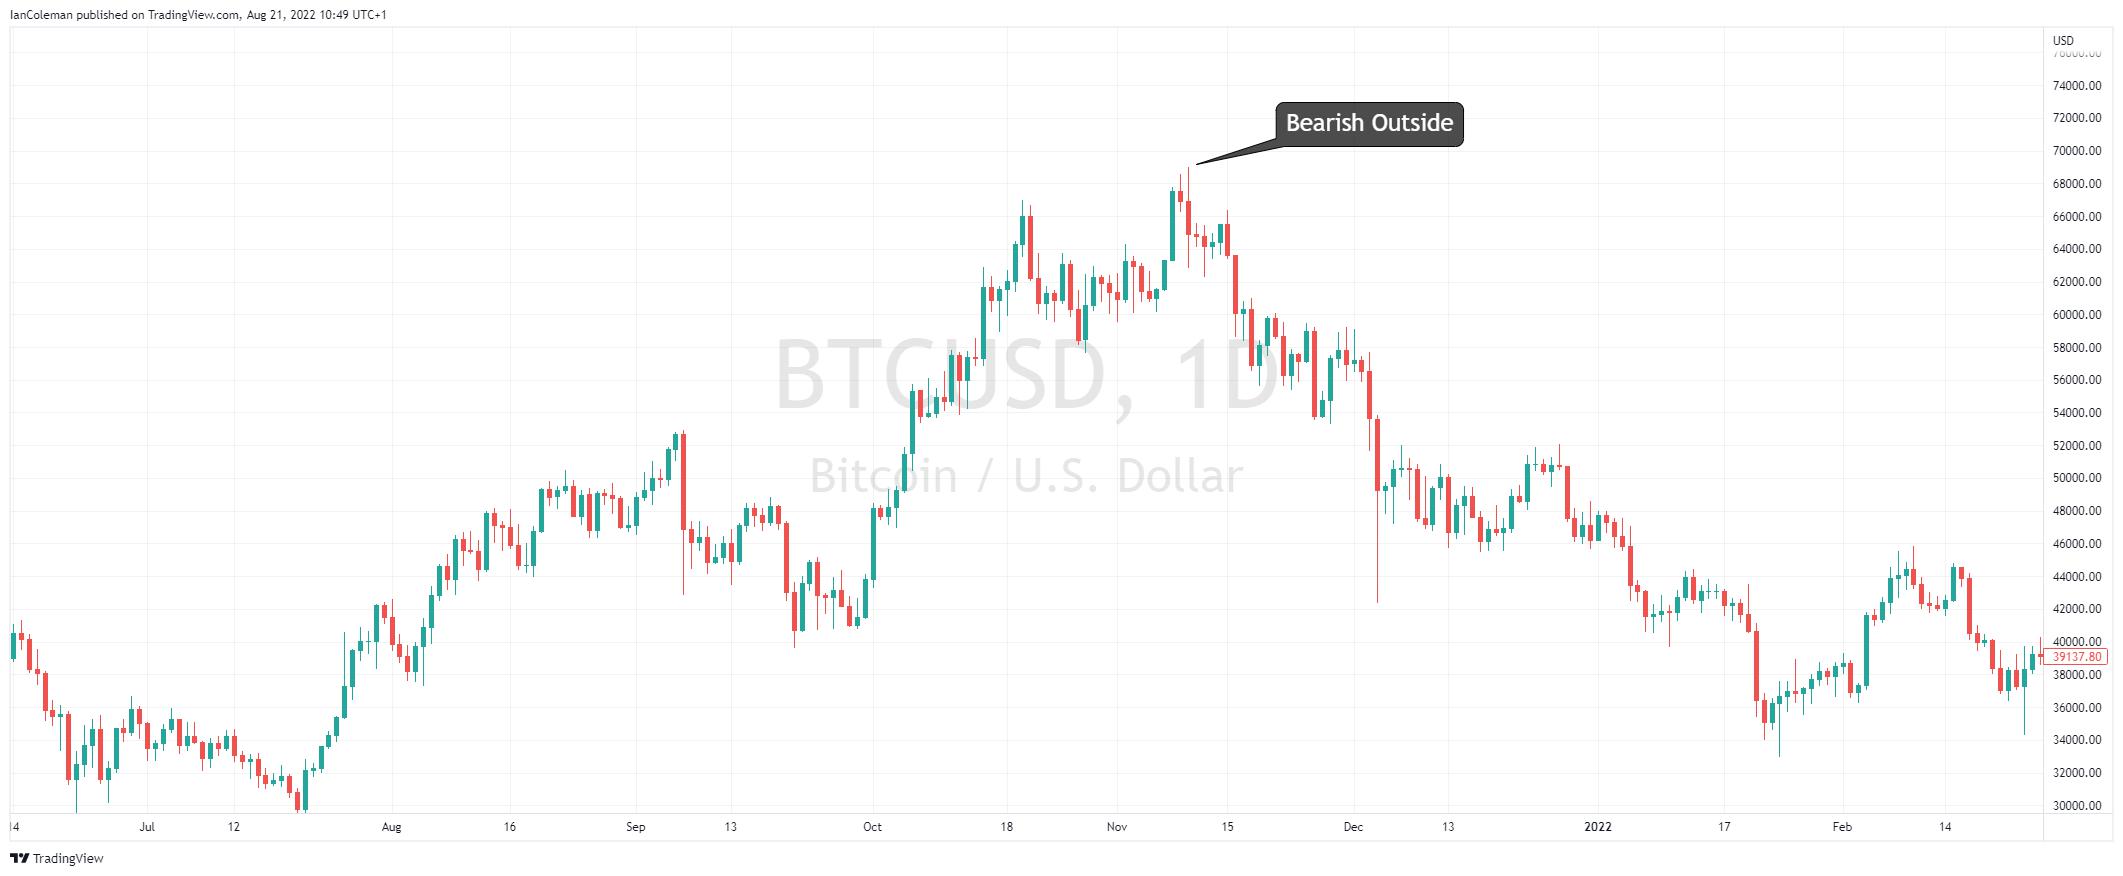
The daily chart highlights a bearish Outside Candle on the 10th of November, at the all-time high, before the current Bitcoin crash.
Where could we possibly see a base according to the Elliott Wave theory
The latest Bitcoin crash looks to have formed a bearish Flag pattern on the weekly chart. To calculate the measured move target of the flag, we take the length of the flagpole (A-B) and project that measurement from the high of the flag, down in the C-D leg. This gives us a projected level of 12173.
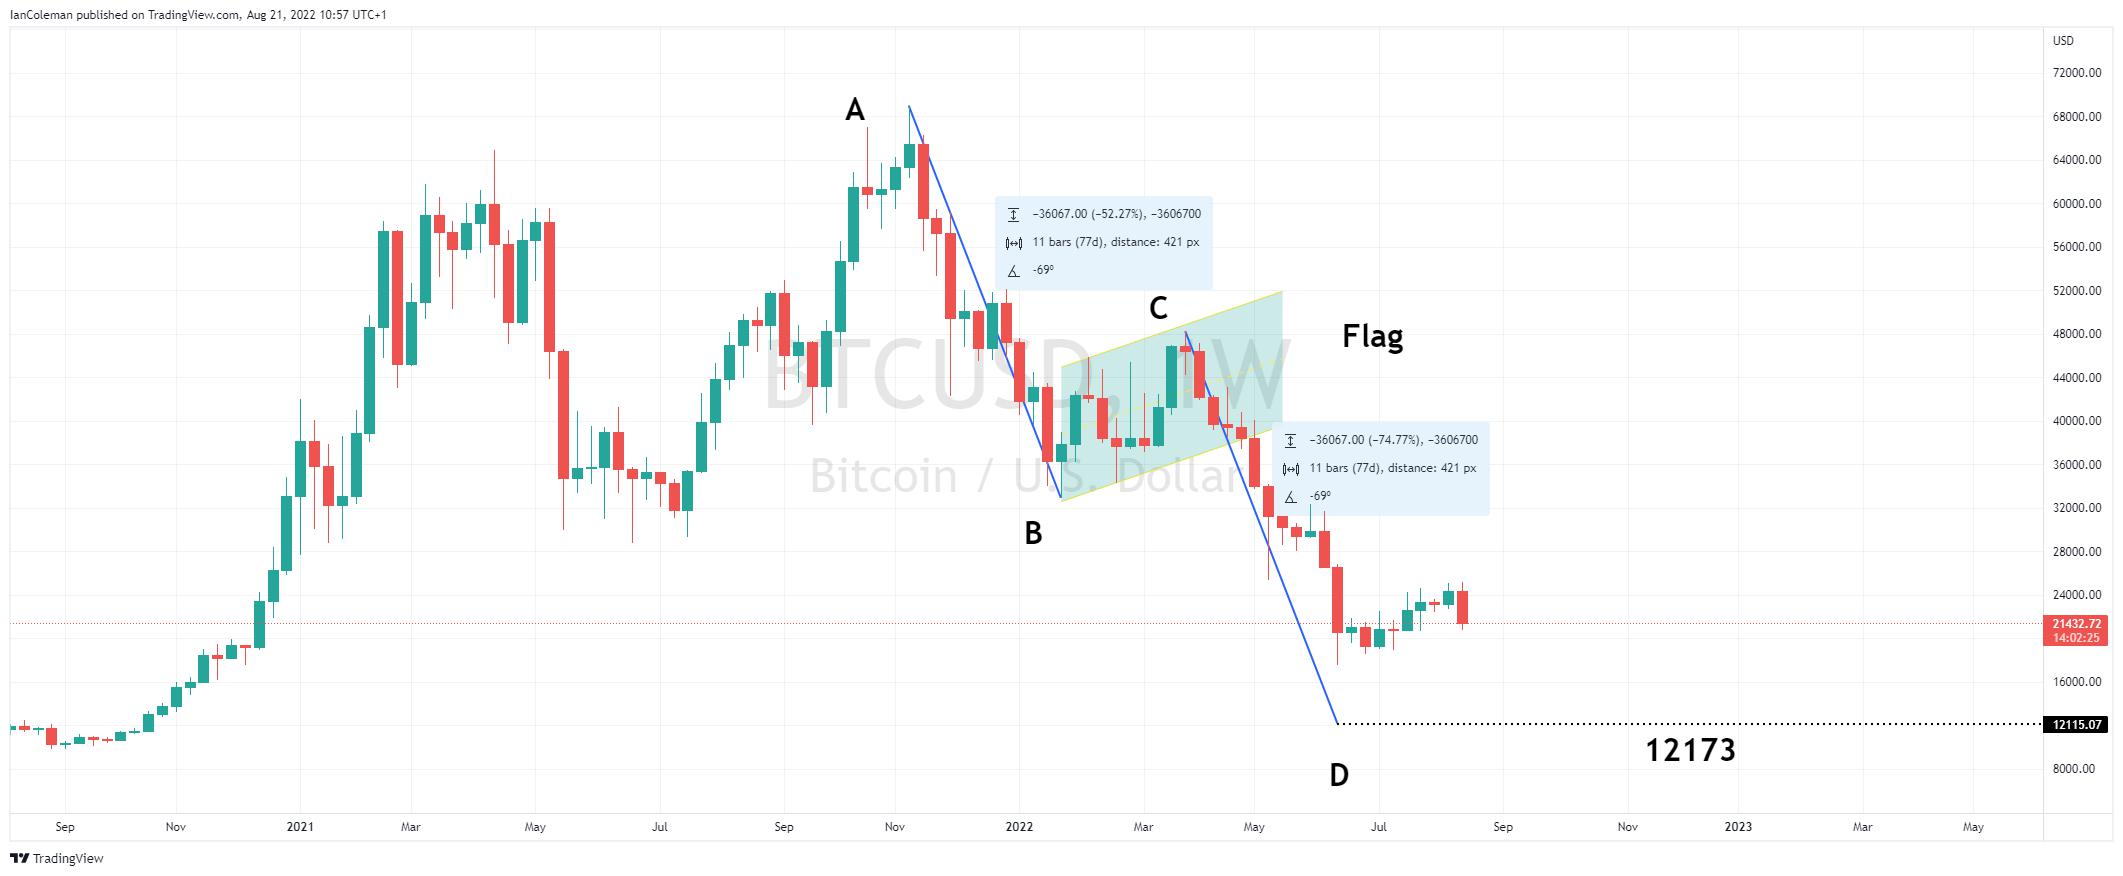
Figure 1 Trading View BTCUSD weekly Flag formation and target
It is a common characteristic of Elliott Wave corrections to form an AB=CD pattern.
As Bitcoin has behaved so well with regards to turning candle formations, perhaps we will see a bullish Outside Candle or a Morning Doji Star at the base!
For more information on candle formations, follow this link.


Pepperstone no representa que el material proporcionado aquí sea exacto, actual o completo y por lo tanto no debe ser considerado como tal. La información aquí proporcionada, ya sea por un tercero o no, no debe interpretarse como una recomendación, una oferta de compra o venta, la solicitud de una oferta de compra o venta de cualquier valor, producto o instrumento financiero o la recomendación de participar en una estrategia de trading en particular. Recomendamos que todos los lectores de este contenido se informen de forma independiente. La reproducción o redistribución de esta información no está permitida sin la aprobación de Pepperstone.