- Español
- English
- 简体中文
- 繁体中文
- Tiếng Việt
- ไทย
- Português
- لغة عربية
- Монгол хэл
$3 Trillion in Q2 borrowing creates uncertainty in currency markets
The cost of protecting the US economy during this crisis has been high, and this new funding will bring Federal debt levels not seen since World War II. With this influx of money, many of the major currencies have had a hard time repricing risk and uncertainty. This has led to several currencies trading in a rangebound state as the market waits for further news of the global re-opening efforts. The month of May is well known for the phenomenon “sell in may and go away” from a stock market perspective, but it will certainly be the month where economies will be tested more than ever before from an economic standpoint. What remains to be seen is if countries will experience a second wave of the virus outbreak, and how much more stimulus may be required to get countries through this period of instability.
USDX remains rangebound on the 4HR chart with no clear direction
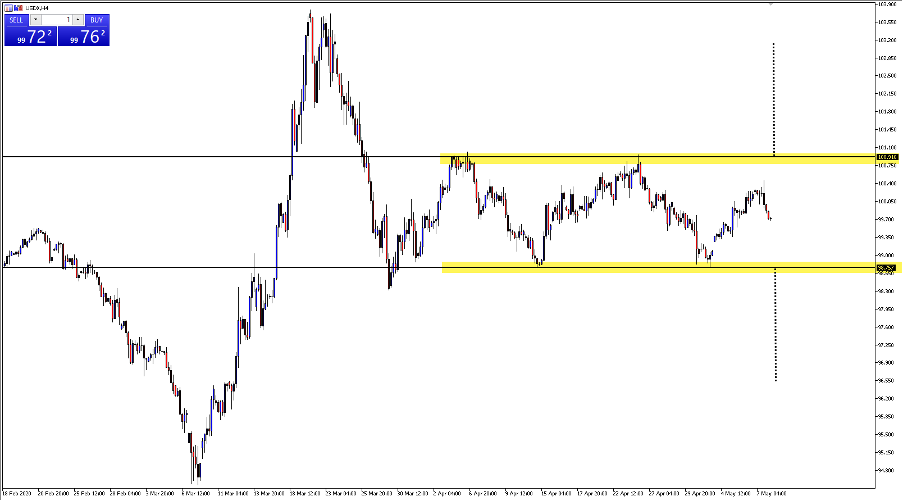
The US Dollar Index (USDX) has remained rangebound between the 101.00 psychological zone and the 98.75 areas (highlighted in yellow) for several weeks now, as traders try to assess what the current government and monetary stimulus measures are doing to the “fair value” of the biggest currency in the world. If price were to move up and break through the 101.00 resistance zone channel pattern, analysis dictates that the next move will be the previous range, with price expected to potentially gravitate towards the 103.00 area. If price however were to move lower and break below the 98.75 support zone, it would be expected that the USDX would sell off, with price moving towards the 96.80 zone (highlighted with the black vertical lines above).
GBPUSD Forms an amazing pattern after hitting strong resistance
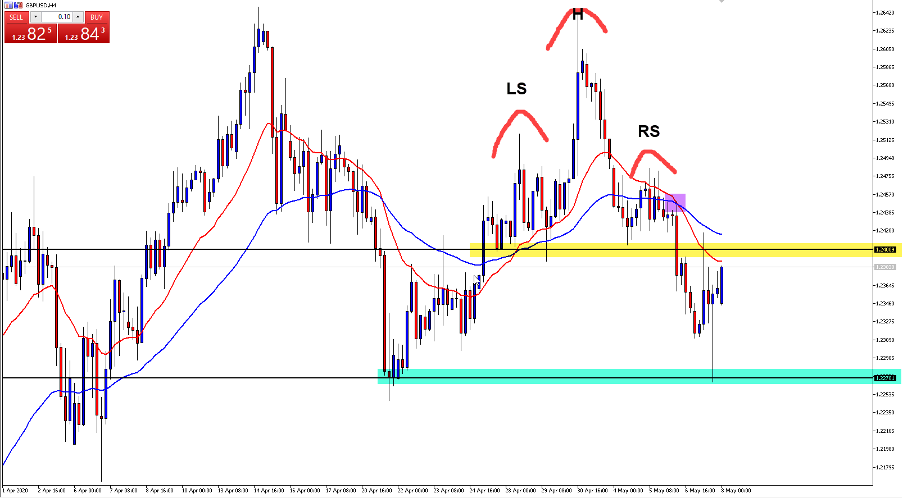
The chart above shows a head and shoulders pattern on the 4HR GBPUSD chart (highlighted by the LS, H and RS tags). The resistance that was formed at the price of 1.26440 was quickly sold off, with downward pressure eventually pushing the GBPUSD to form a lower right shoulder, followed by a quick selloff under the yellow highlighted psychological area of 1.2400. As price moved below 1.2400, the 20-exponential moving average (red line) crossed the 50-exponential moving average (blue line) highlighted in purple, giving technical traders further confirmation that the sellers were in control. Price then moved further downwards, with sellers applying pressure to push the pound to the next support at 1.2270. As it is with many patterns in times of volatility, clear support is cutting short the general take profit areas.
Gold (XAUUSD) begins its potential move up
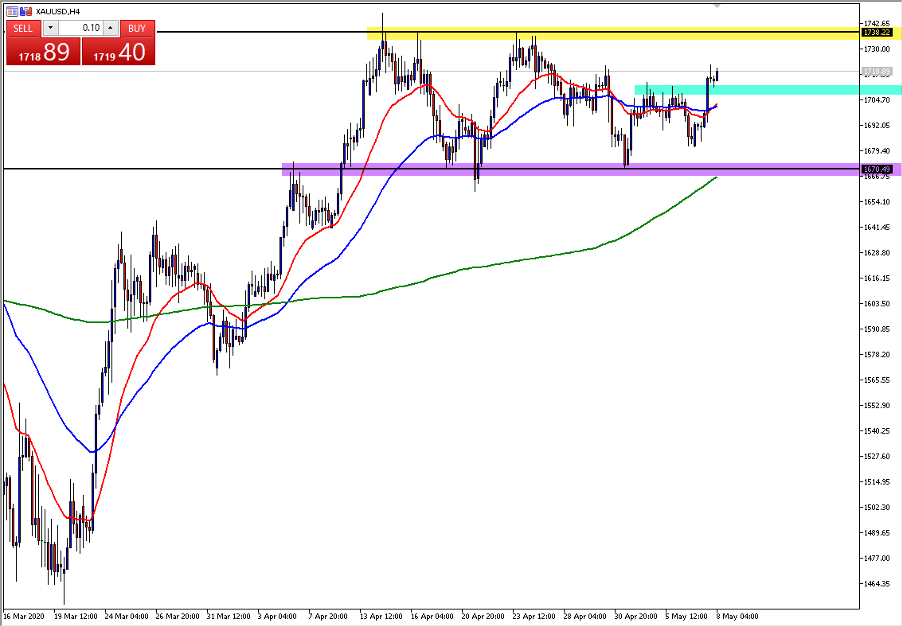
Gold (XAUUSD) has been one of the best trading pairs of 2020 so far. In recent weeks price has remained relatively calm, with price trapped between the 1670 support zone (highlighted in purple) and the 1738 resistance zone (highlighted in yellow). Price moved higher over the last 24 hours with investors starting to see Gold as an opportunity to potentially hedge against uncertainty in global markets. Price broke to a new high (highlighted in green) with a 20-exponential moving average (red line) crossing above the 50-exponential moving average (blue line) on the 4hr chart, signalling that buyers may be wanting to test the 1670 resistance again in the near term.
Global fiscal policies remain at the forefront of market repricing
As the US looks to print unprecedented levels of money, most investors will continue to watch the US Dollar for signs of strength or weakness in the world’s largest pairs. The rangebound state that many pairs are in can only last for so long, and it would be expected that when one area breaks, this will be met with increased volatility. As a trader, paying special attention to economic calendar events and where the market gravitates to before these events will be key for the month of May.
Related articles


Artículos más leídos
¿Listo para operar?
Comenzar es fácil y rápido – incluso con un depósito pequeño. Aplique en minutos con nuestro simple proceso de solicitud.
Pepperstone no representa que el material proporcionado aquí sea exacto, actual o completo y por lo tanto no debe ser considerado como tal. La información aquí proporcionada, ya sea por un tercero o no, no debe interpretarse como una recomendación, una oferta de compra o venta, la solicitud de una oferta de compra o venta de cualquier valor, producto o instrumento financiero o la recomendación de participar en una estrategia de trading en particular. Recomendamos que todos los lectores de este contenido se informen de forma independiente. La reproducción o redistribución de esta información no está permitida sin la aprobación de Pepperstone.