- Español
- English
- 简体中文
- 繁体中文
- Tiếng Việt
- ไทย
- Português
- لغة عربية
- Монгол хэл

S&P500 (poor) market breadth - the bears have been pushing this one hard of late.
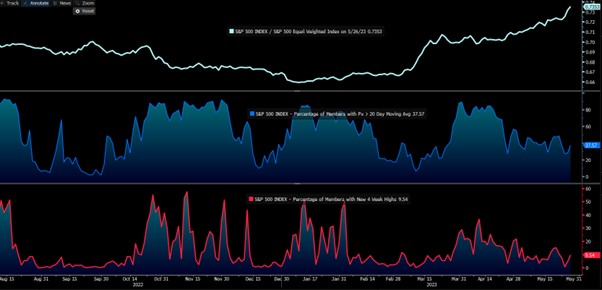
By order of panes:
Upper
S&P500 (weighted according to its market capitalisation) / S&P500 equal-weighted index (this assumes all index constituents have the exact same index weight)
Middle
% of companies (in the S&P500) trading above the 20-day MA
Lower
% of companies (in the S&P500) trading at 4-week highs
There has been so much focus on the poor index breadth and participation in the NAS100 and US500 of late, and this chart portrays it well. The bears are clinging to the notion that if we lose leadership from mega-cap tech (and notably the AI thematic) then the broader index will roll over and head lower. That could be the case, however, we could also see investors switch to other areas of the market. Backtesting prior periods where we see the S&P500 equal-weighted index underperform by such a wide margin (with such concentrated breadth) offers no statistical evidence that the index is about to crash.
Still, consider that all the index gains this year have come from 7 stocks (Apple, Microsoft, NVIDIA, Alphabet, Amazon, Meta and Tesla), so if we lose this leadership, then the index may find it hard to push further higher. For now, momentum favours further index upside.
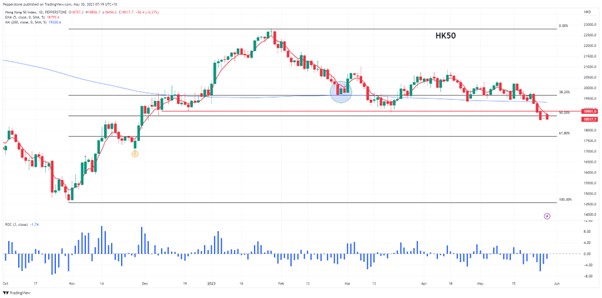
HK50 index
while we see strength and momentum in the US tech-heavy indices, we’re seeing a heavy tape in the HK50, with the HK50 not far off a 20% drawdown from the 27 Jan highs. Poor China economic data, renewed tensions with the US, and uninspiring earnings from MSCI China companies (reported earnings have missed consensus by 20.7%) have all weighed and resulted in a capital flight from Chinese markets. The technicals remain heavy, and subsequently, I still favour further downside in the HK index towards 17,700 – that said, there are risks that authorities address the weakness in the capital markets soon – for now, international capital is weary of being overweight HK/China at this point.
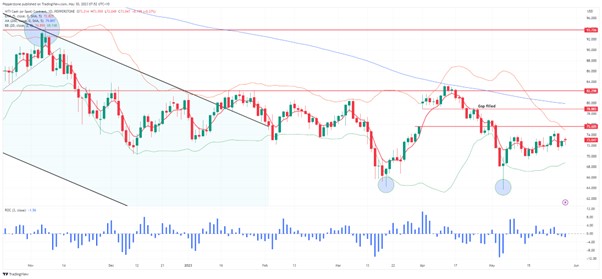
US interest rates pricing
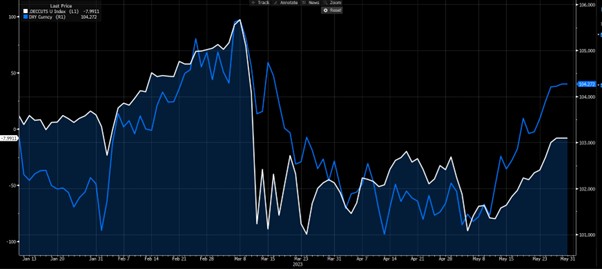
This chart portrays the number of cuts/hikes priced into the US rates market through to December – I have overlapped the USD index against this (DXY), but there is a strong (inverse) relationship with gold too. On 4 May the market was pricing (as a central case) 90bp of cuts by December – nearly four 25bp cuts – where this now stands at just 8bp of cuts. This repricing has been swift, but warranted, as the inflation and data dynamics offer a very high barrier to a cut this year. Now that rate expectations are back to a neutral setting, will this repricing limit the near-term moves in the USD?
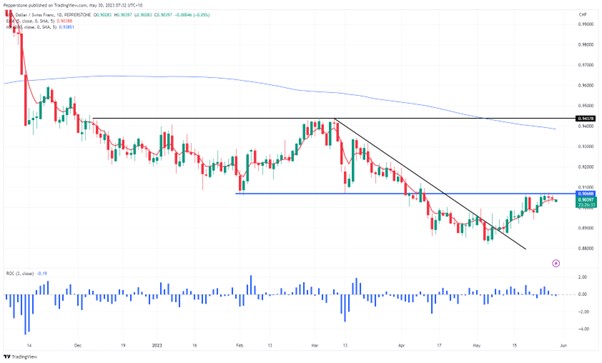
USDCHF
With an eye on US nonfarm payrolls this Friday and CPI next week, and with the market pricing out rate cuts by December, the USD remains front and centre. The form guide suggests a higher probability of an above consensus NF jobs print (consensus is 190k), but the market will also be positioned for this, and the unemployment rate and wage data matter equally. Much of the recent flow has been in USDJPY and EURUSD as clear expressions of USD strength, but USDCHF is pushing horizontal resistance. I would be flat here and let the market guide. Preference is to initiate longs on a daily close above 0.9068, as this may start to bull trend as we’ve already seen in USDJPY – however, positioning in USDCHF is cleaner. The pair could roll over and find sellers though, but I’d argue the downside would be less pronounced, although that would be determined by the news flow.
CHFJPY
Is also of interest but for different reasons…CHFJPY sits at its highest level since 1979, but the JPY is universally weak as traders look for carry opportunities. I know many a looking at selling up here, but timing is always key when utilising leverage.
SpotCrude
weighing up the prospect of more explosive price action?
While crude is getting some uplift from the US debt limit deal, we now look ahead to Sunday’s OPEC meeting. We see consolidation in the price action and traders are happy to be actively trading a tight range here. While the Saudis have cautioned market players against being short crude, the Russians have poured water on potential further reduction to supply. Could we see a gap on open next week? The OPEC meeting could be well worth researching if holding crude exposures, and a tight range may see more explosive price action.
Related articles
Pepperstone no representa que el material proporcionado aquí sea exacto, actual o completo y por lo tanto no debe ser considerado como tal. La información aquí proporcionada, ya sea por un tercero o no, no debe interpretarse como una recomendación, una oferta de compra o venta, la solicitud de una oferta de compra o venta de cualquier valor, producto o instrumento financiero o la recomendación de participar en una estrategia de trading en particular. Recomendamos que todos los lectores de este contenido se informen de forma independiente. La reproducción o redistribución de esta información no está permitida sin la aprobación de Pepperstone.