- Español
- English
- 简体中文
- 繁体中文
- Tiếng Việt
- ไทย
- Português
- لغة عربية
- Монгол хэл

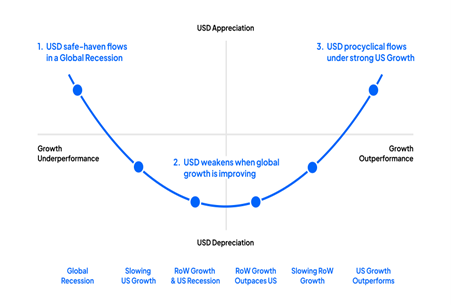
The basic principle is we can think more strategically about the regime that drives the USD, and this has consequences for price, and by extension commodities and other second-order derivatives of the USD.
- Left-hand side – the focus here is risk aversion across broad financial markets – this could be driven by several factors, including an increased recession risk and geopolitics – but increased market stress and the USD will typically attract buyers. Conversely, a risk rally will see capital flow out of the USD
- Right-hand side – the US exceptionalism story – in some capacity the idea of TINA rings true here – that being, ‘There is No Alternative - where investors see the US as having the most resilient economy and considered to be the most attractive investment destination
- The middle section sets a focus on a regime of synchronized global growth/contraction – essentially in a synchronized global growth upturn, perhaps with rising liquidity, we typically see bearish trends in the USD and clear outperformance in cyclical currencies, such as the AUD, NZD, and NOK
USD drivers into October ‘22
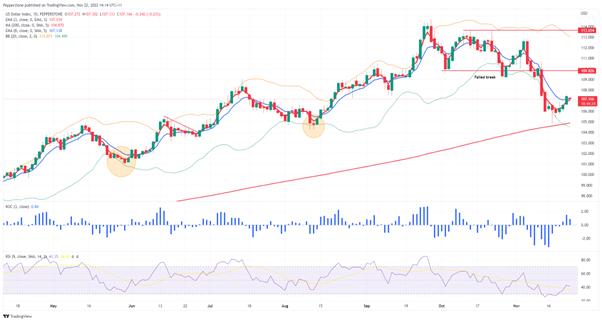
As we see on the daily, the USD rallied throughout 2022 peaking in September and October, with both the left- and right-hand sides of the ‘Smile’ working concurrently for the USD. This is a rarity, but can be a potent force, especially given this time around we went through a regime shift from zero interest rates and QE to rapid rate hikes.
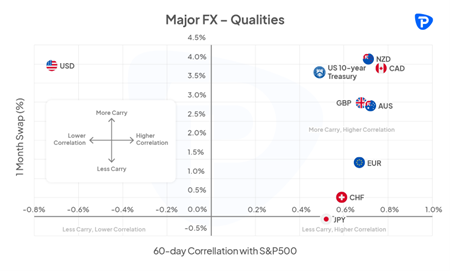
A deeper dive as to the left-hand drivers, we saw fears of a global slowdown and economic contraction driving capital into the safety of the USD – as we see in chart below (“Major FX – Qualities), the USD was unequivocally negatively correlated with the S&P500, providing a strong and unrivalled hedge against equity drawdown – the fact that cash-like assets (I’ve used 1-month swaps) in the US pay some of the highest rates meant traders achieved compelling levels of ‘carry’ or income – in effect, funds are still paid to play defence.
On the right-hand side, fears of a deeper economic contraction in China, Europe, and the UK, certainly on a relative basis, again saw the USD outperform. We can also see that while inflation rose aggressively in most DM countries, we also seen dovish pivots from the BoE, ECB, and RBA, and yet the Fed have kept a consistent tone – well, at least Jay Powell has.
A USD decline
After the US CPI report (10 Nov) we saw the USD take a dive, stopping just shy of the 200-day MA – on one hand, the right side of the ‘Smile’ becoming less USD positive – where rate hikes were priced out and the terminal expectation of the fed funds rate fell to 4.87% (from north of 5%).
We can also see the mid-part of the ‘Smile’ worked against the USD - We saw China looking less bad, with its plans to allow property developers easier access to capital, amid a multi-step guide to unwind its Covid zero policy, presumably after the ‘Two Sessions’ sitting in March 2023.
There has been a less bad feel towards Europe, with EU Nat Gas prices falling from €342 to €100 – EU data, more broadly, held up and Italian BTP spreads were contained vs German bunds.
A USD turn – but can it last?
Since the lows in the USD (I’ve used the USD index / USDX as my proxy) on 15 Nov we’ve seen a reasonable counter-rally back above 107 – the technicians will argue the USD was oversold and due a bounce anyhow. However, if we think about the news flow and how it relates to the ‘smile’ theory, we’ve seen the emergence of increased uncertainty on China’s Covid plans – Korean 20-day exports fell 16.7%, while Taiwanese exports fell 6.3% YoY. Crude and copper have shown us the way, but traders are expressing a view of a global growth slowdown, which of course favours USD strength.
The news flows may change as we head into what will be a big December by way of event risk– bad US data will impact the right-hand side of the smile and weaken the USD, especially if the US labour market shows real signs of cooling and core CPI undershoots again. Should US data hold up, but Chinese and EU data deteriorates, well that’s USD positive, especially if we see an equity drawdown.
I’ve not seen a momentum USD buy signal on the longer-time frames yet – however, with terminal fed funds pricing above 5%, which we consider that to be fair, it feels like global growth is probably the factor that will drive the USD into year-end. The smile could be a good guide to think about the USD direction.
Related articles

Pepperstone no representa que el material proporcionado aquí sea exacto, actual o completo y por lo tanto no debe ser considerado como tal. La información aquí proporcionada, ya sea por un tercero o no, no debe interpretarse como una recomendación, una oferta de compra o venta, la solicitud de una oferta de compra o venta de cualquier valor, producto o instrumento financiero o la recomendación de participar en una estrategia de trading en particular. Recomendamos que todos los lectores de este contenido se informen de forma independiente. La reproducción o redistribución de esta información no está permitida sin la aprobación de Pepperstone.