- Français
- English
- Español
- Italiano
Some basic information about Westpac
Westpac Banking Corporation, short code WBC, is the third largest bank in Australia by market cap, trailing behind the Commonwealth Bank of Australia and National Australia Bank.
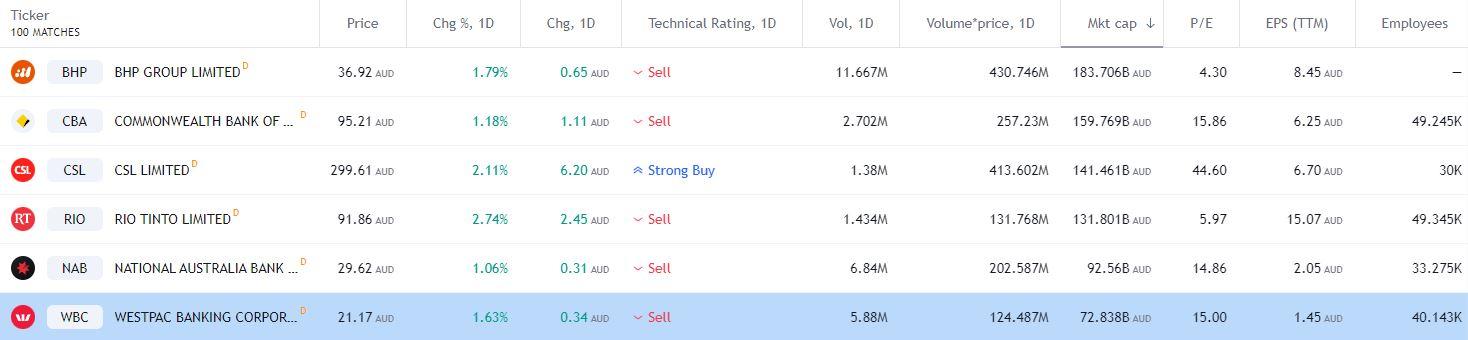
Figure 1 Trading View Market Cap
Referred to simply as Westpac, they are known as Australia’s First Bank and employ over 40 thousand people.
The rally from 2020 lows
The Westpac share price performed well with a rally of just over 100% from the 2020 low of 13.47, to the June 2021 high of 27.12.
Westpac Share Price Monthly Chart
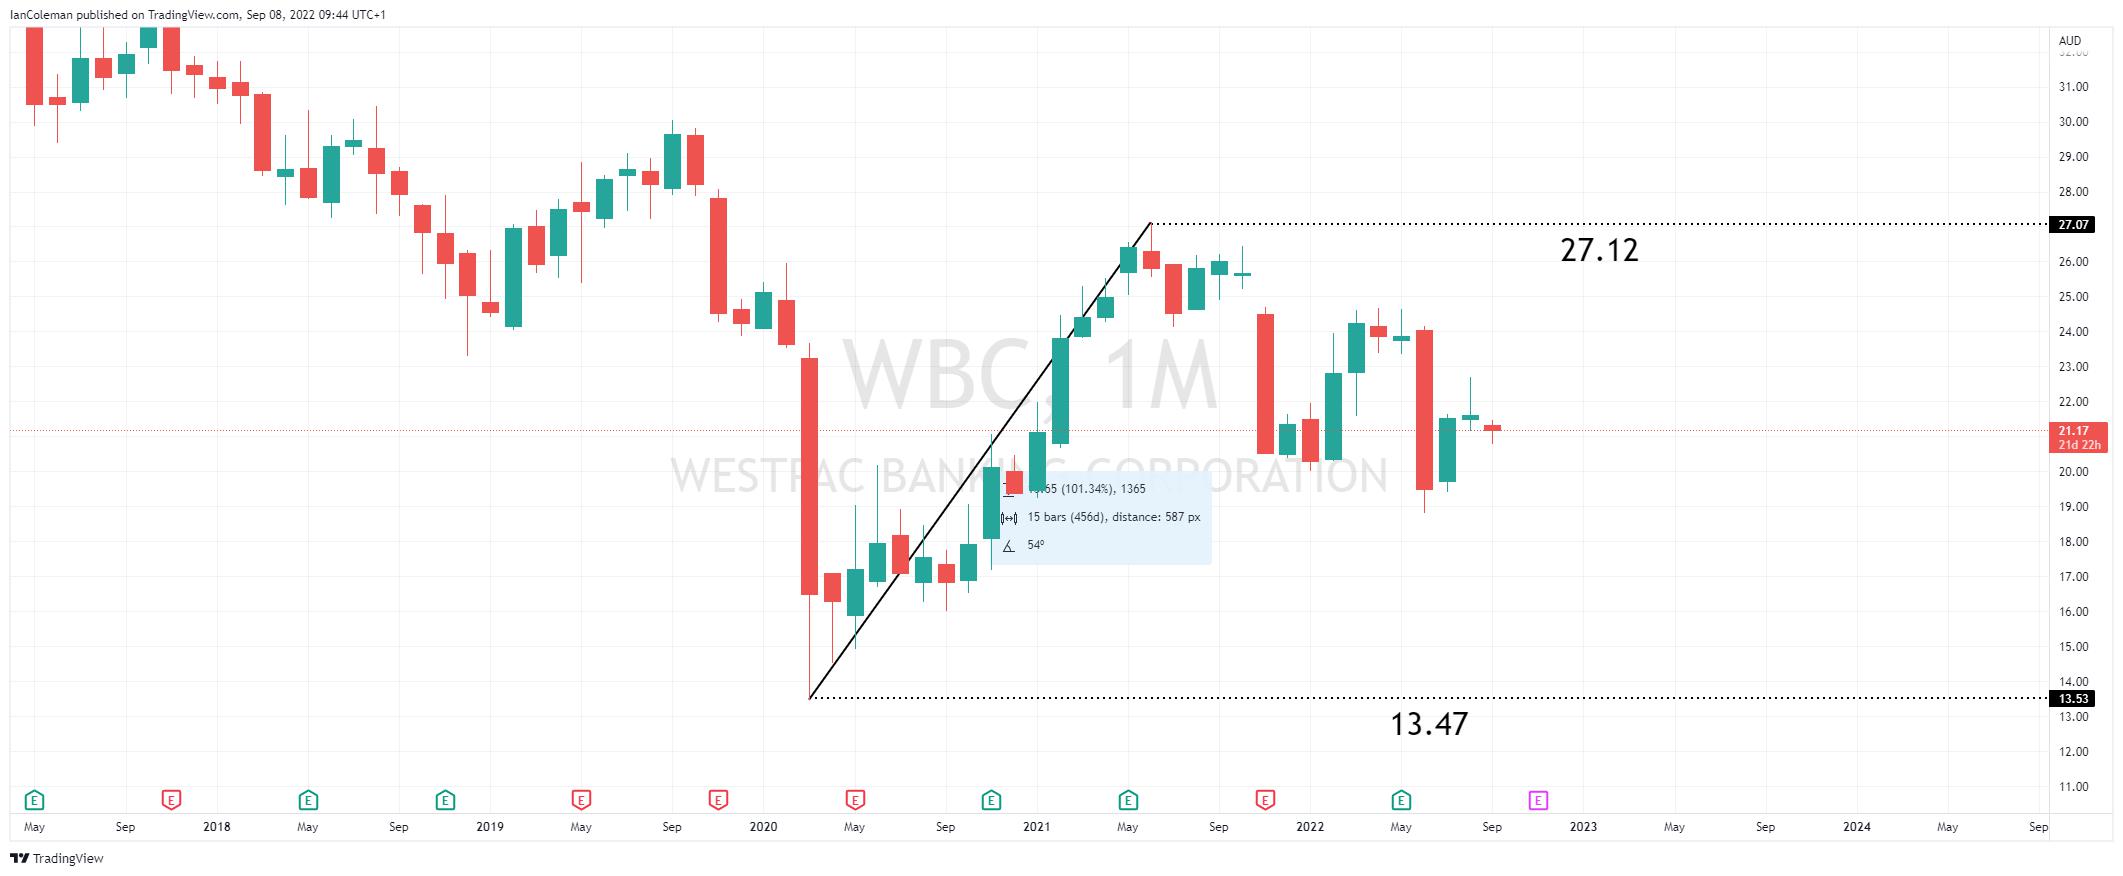
Figure 2 Trading View Westpac 100% increase
But how did the Westpac Share Price perform against its peers?
The Australian Banking sector has seen a broad-based rally from the 2020 base. In the chart below we can clearly see Westpac underperforming against the likes of Commonwealth Bank of Australia and the National Australia Bank over the same period.
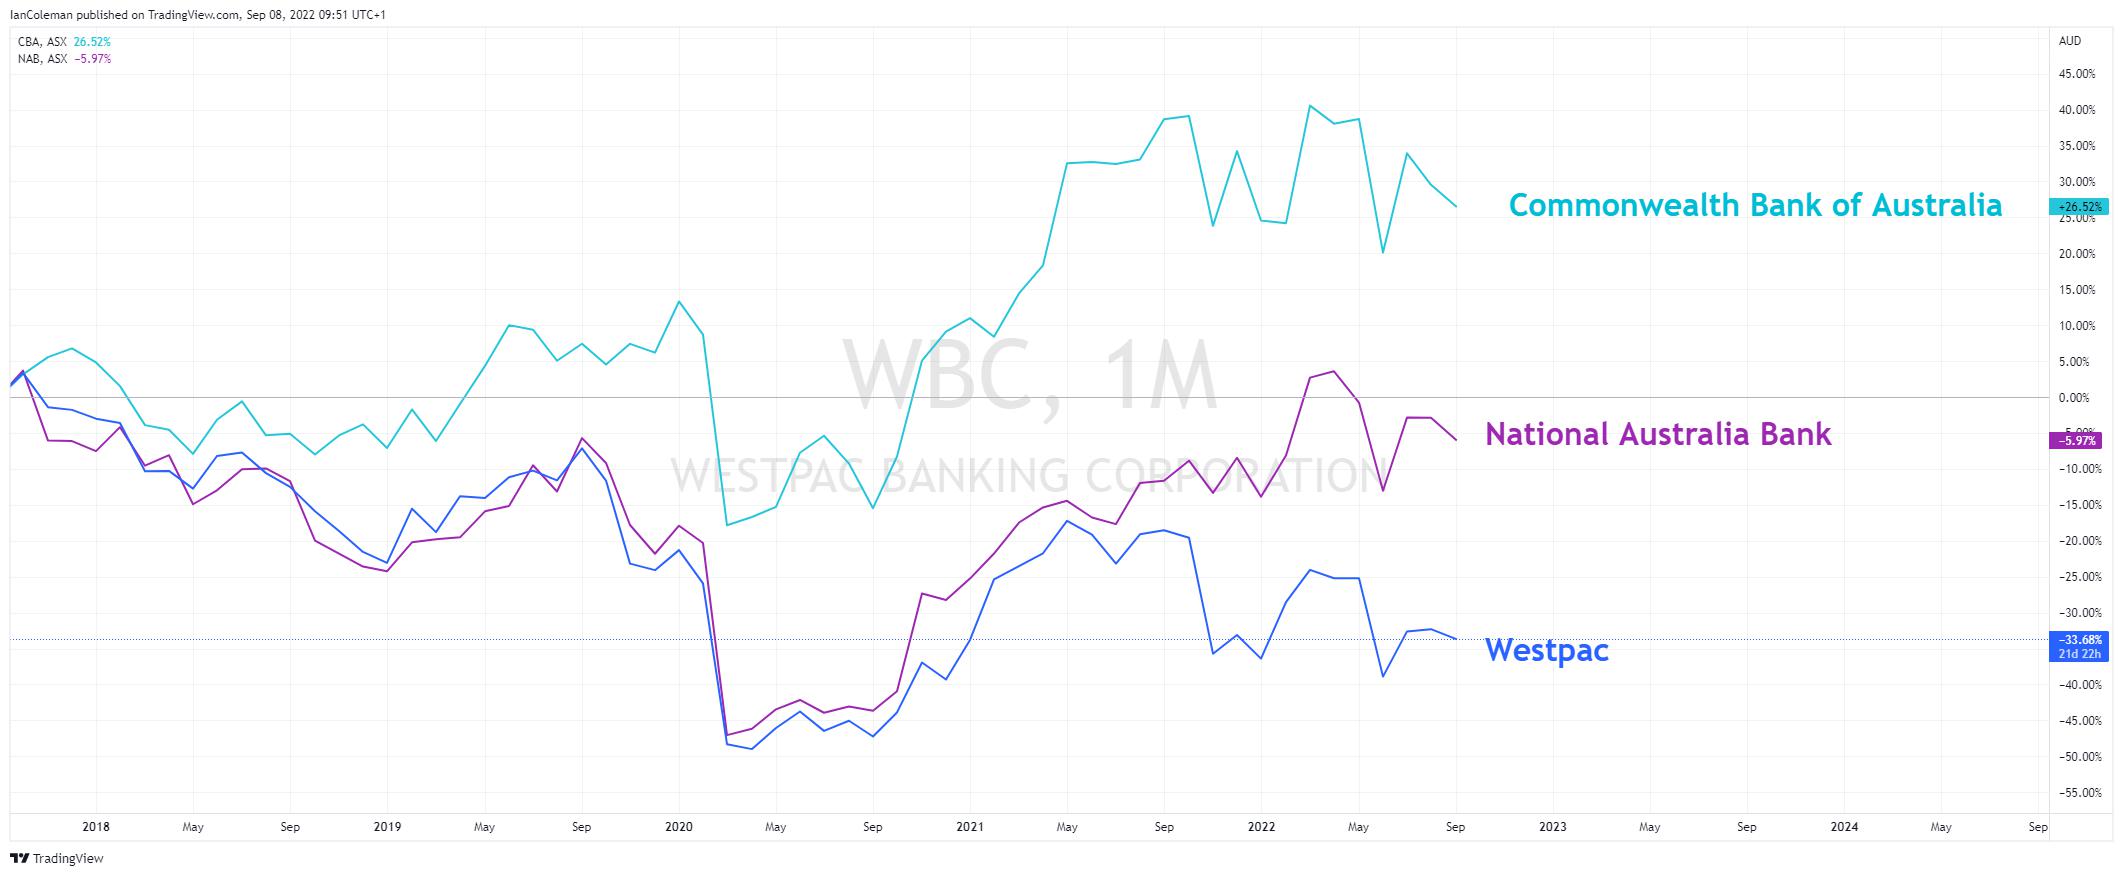
Figure 3 Trading View Banking Sector performance
A look from a technical perspective
A look at the weekly chart and we see two dramatic moves to the downside. The first occurred in the week 1st November. This was after earnings missed by a dismal -5.3%. The second occurred when the RBA, The Reverse Bank of Australia, stunned the market with a higher-than-expected interest hike of +50 basis points. This was the biggest hike in 22 years and took the rate to 0.85%.
Westpac was one of the first big banks to pass on the full increase to its variable home loan customers.
Westpac Share Price Weekly Chart
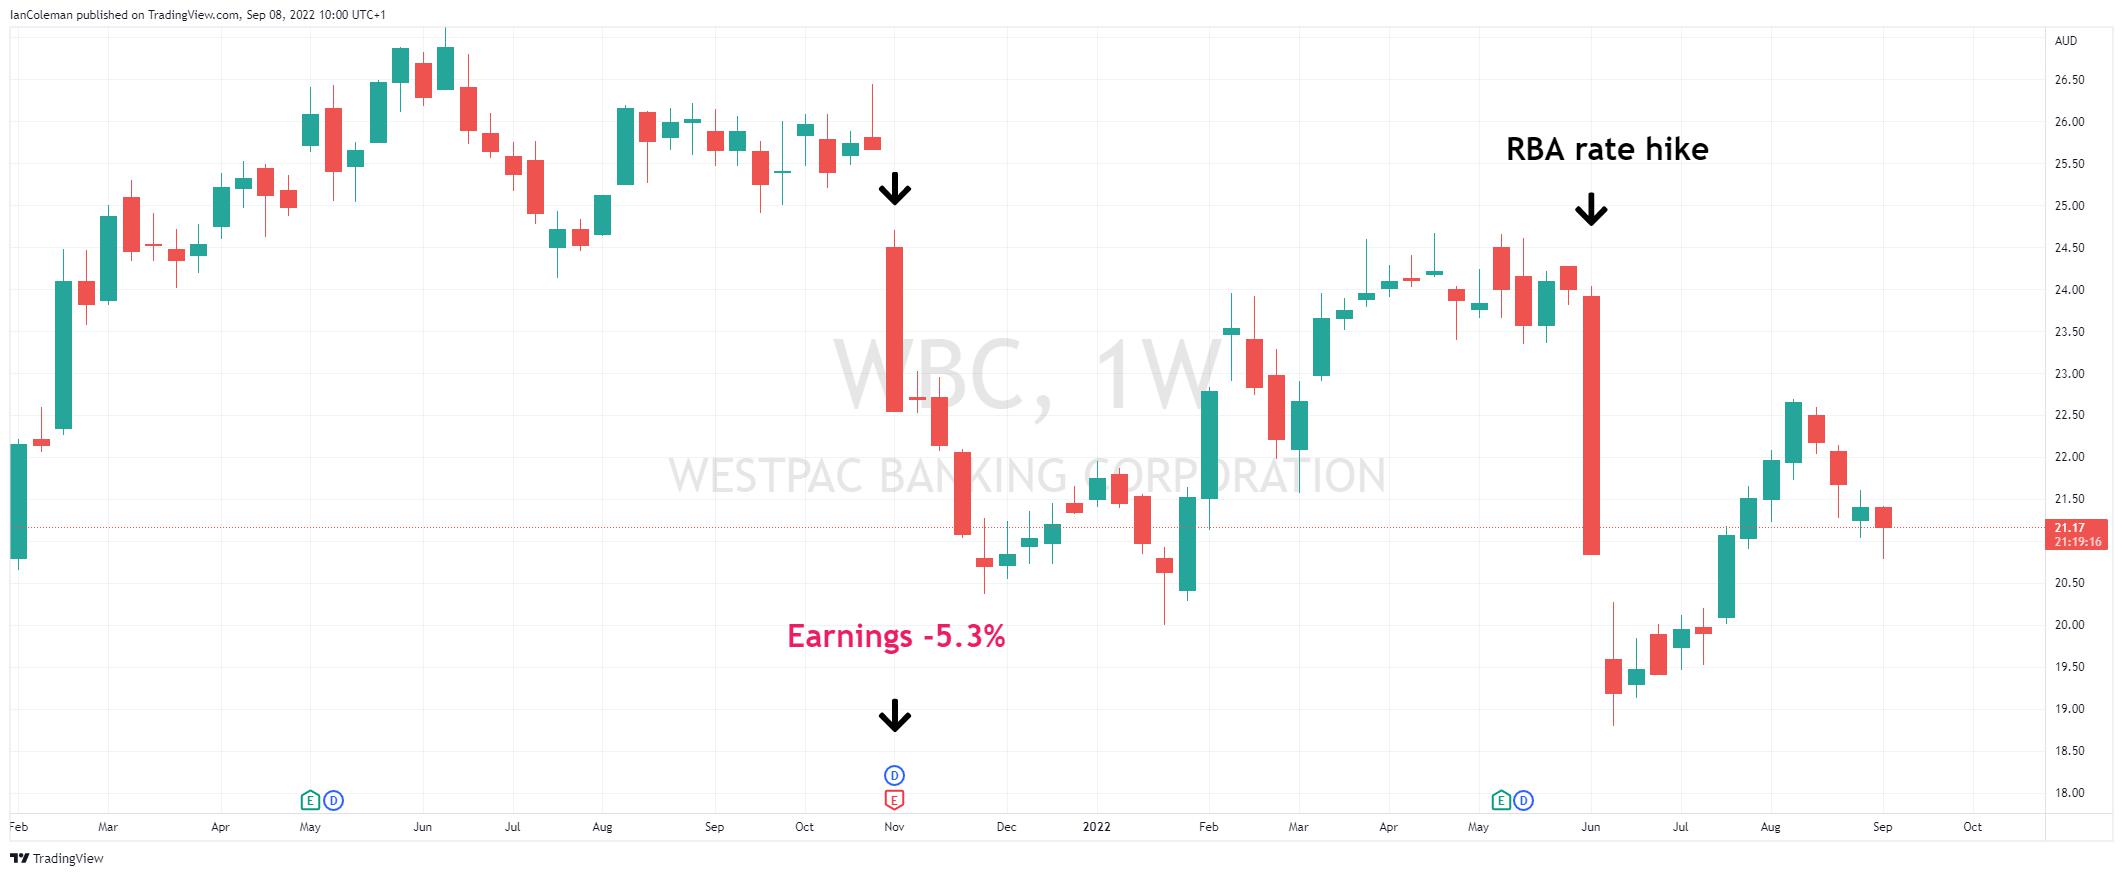
Figure 4 Trading View Weekly declines
Where to now for the Westpac Share Price?
The choppy and erratic price action in the Westpac share price has resulted in an Expanding Wedge being posted on the weekly chart. Although this formation has a mild bias to break to the upside, there is ample scope for a move in either direction in the short term.
Westpac Share Price Weekly Chart
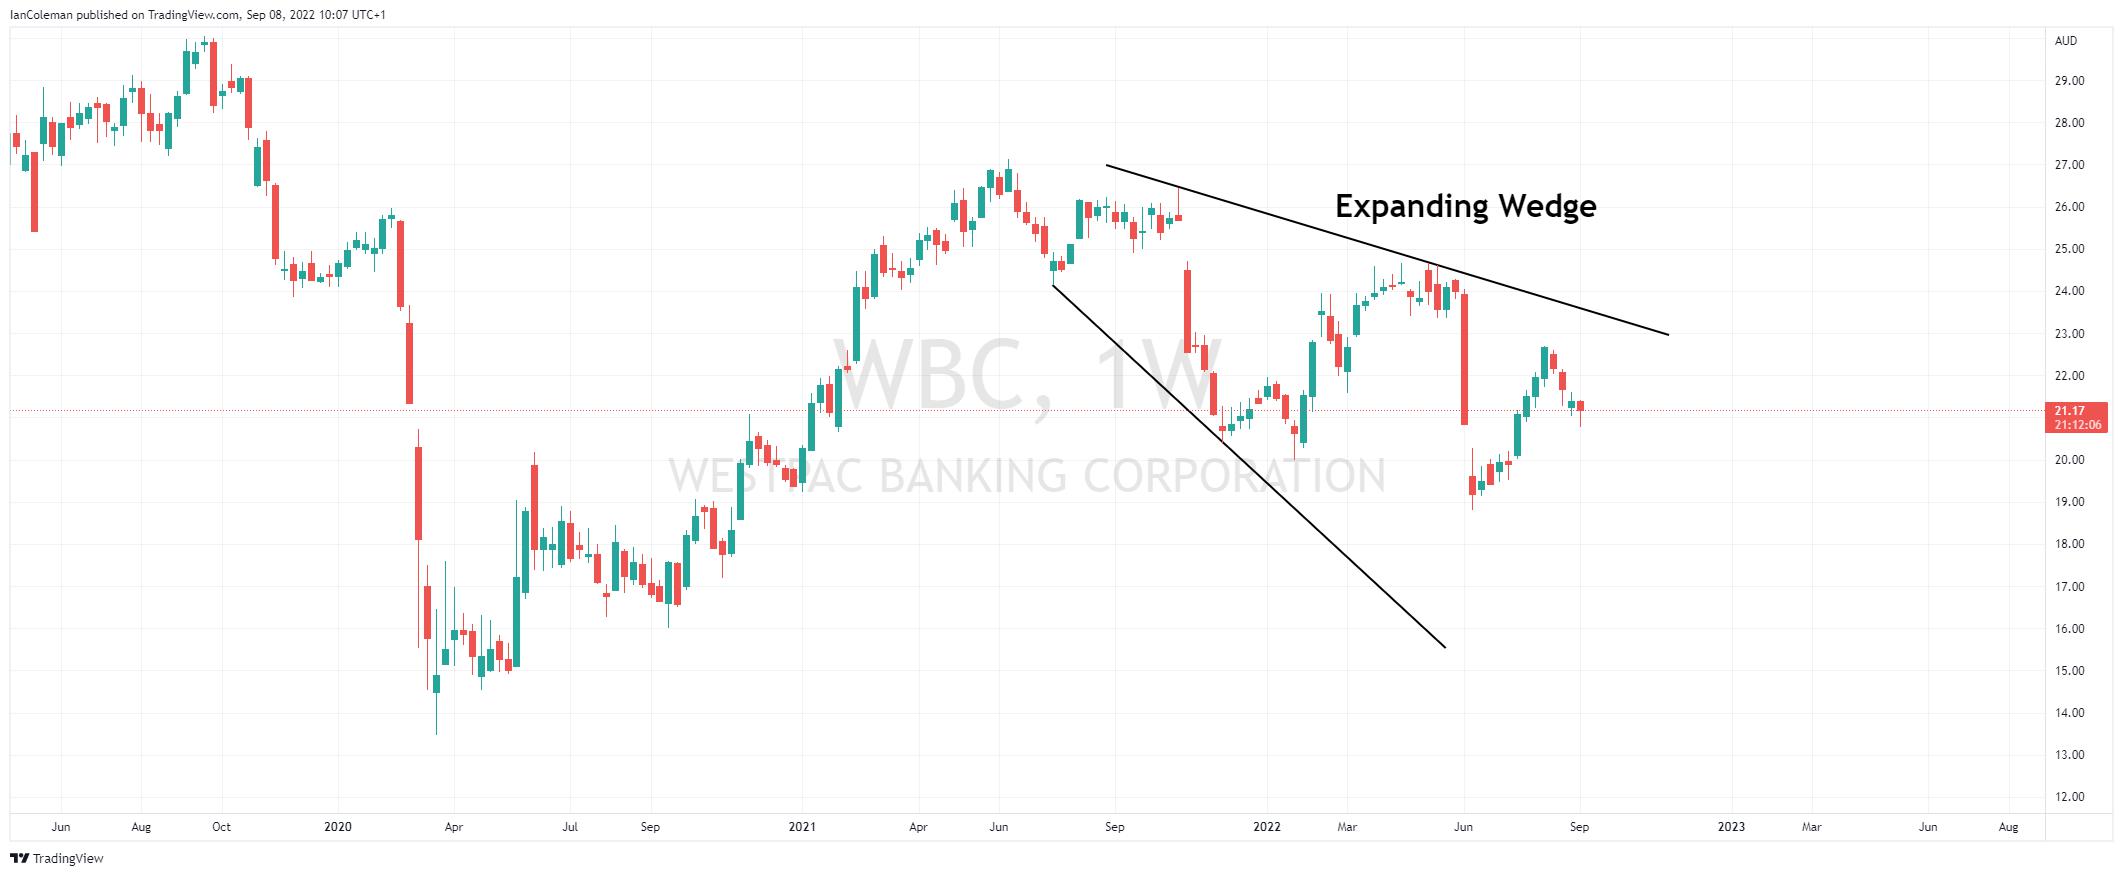
Figure 5 Trading View Westpac Expanding Wedge
One possible support level to watch is 16.41. That would form a bullish technical cypher pattern known as a Gartley – 222. The next earnings report is due on the week 6th of November.
Westpac Share Price Weekly Chart
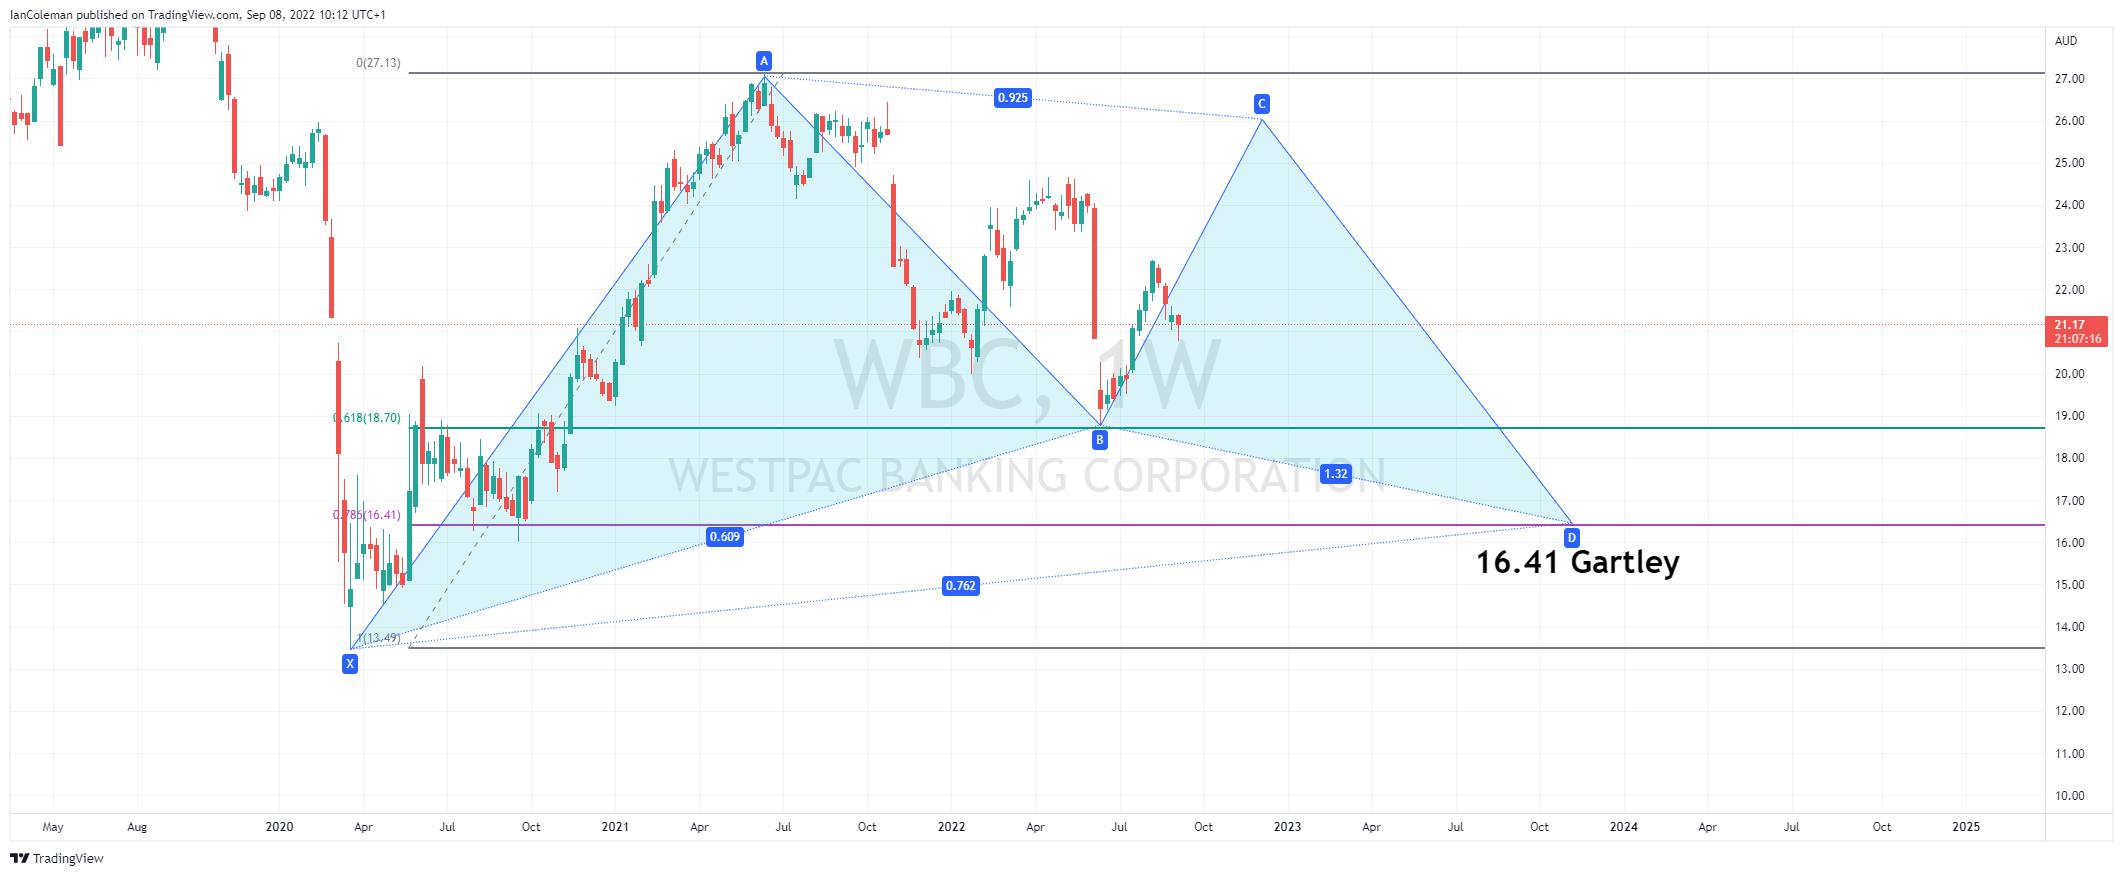
Figure 5 Trading View Westpac Gartley