Pepperstone logo
Pepperstone logo
  • Français
  • English
  • Español
  • Italiano
  • Trading

    Vue d'ensemble

    La tarification

    Caractéristiques de nos Comptes

    Compte CFD Risque Limité

    Comptes de négociation

    Pro

    Heures de négociation

    Calendrier de maintenance

  • Plateformes

    Vue d'ensemble

    Plateformes de négociation

    Intégrations

    Outils de trading

  • Marchés et symboles

    Vue d'ensemble

    Le marché des changes

    Actions

    ETF

    Indices

    Matière Première

    Indices de devises

    Dividendes pour les CFDs sur indices

    Dividendes pour CFDs d'actions

    CFDs à terme

  • Analyse

    Vue d'ensemble

    Naviguer sur les marchés

    Le Daily Fix

    Rencontrez les analystes

  • Apprenez à trader

    Vue d'ensemble

    Guides de trading

    Séminaires en ligne

  • Les partenaires

  • A propos de nous

  • Aide et assistance

  • Professionnel

  • Français
  • English
  • Español
  • Italiano
Trading

What are the most popular forex patterns to trade?

Pepperstone
Pepperstone
Trading Guides
23 août 2022
Share

How are forex patterns made?

Forex patterns are made by the movement of a currency pair on a price chart. By deciphering these forex patterns, we can give ourselves a bias on the next price move. Some patterns come with projected targets known as the ‘measured move’.  This forms part of a study known as technical analysis.

In this blog we will look at bearish formations. Please keep in mind that these forex patterns can all be reversed to highlight a bullish scenario instead.

Reversal Patterns

Double or Treble Top or Bottom

A double or treble top occurs when sellers appear at a price level. This is the initial resistance where the first selloff is seen. Buyers then return to test the previous resistance zone. A push lower from this area forms a double top.

Preview

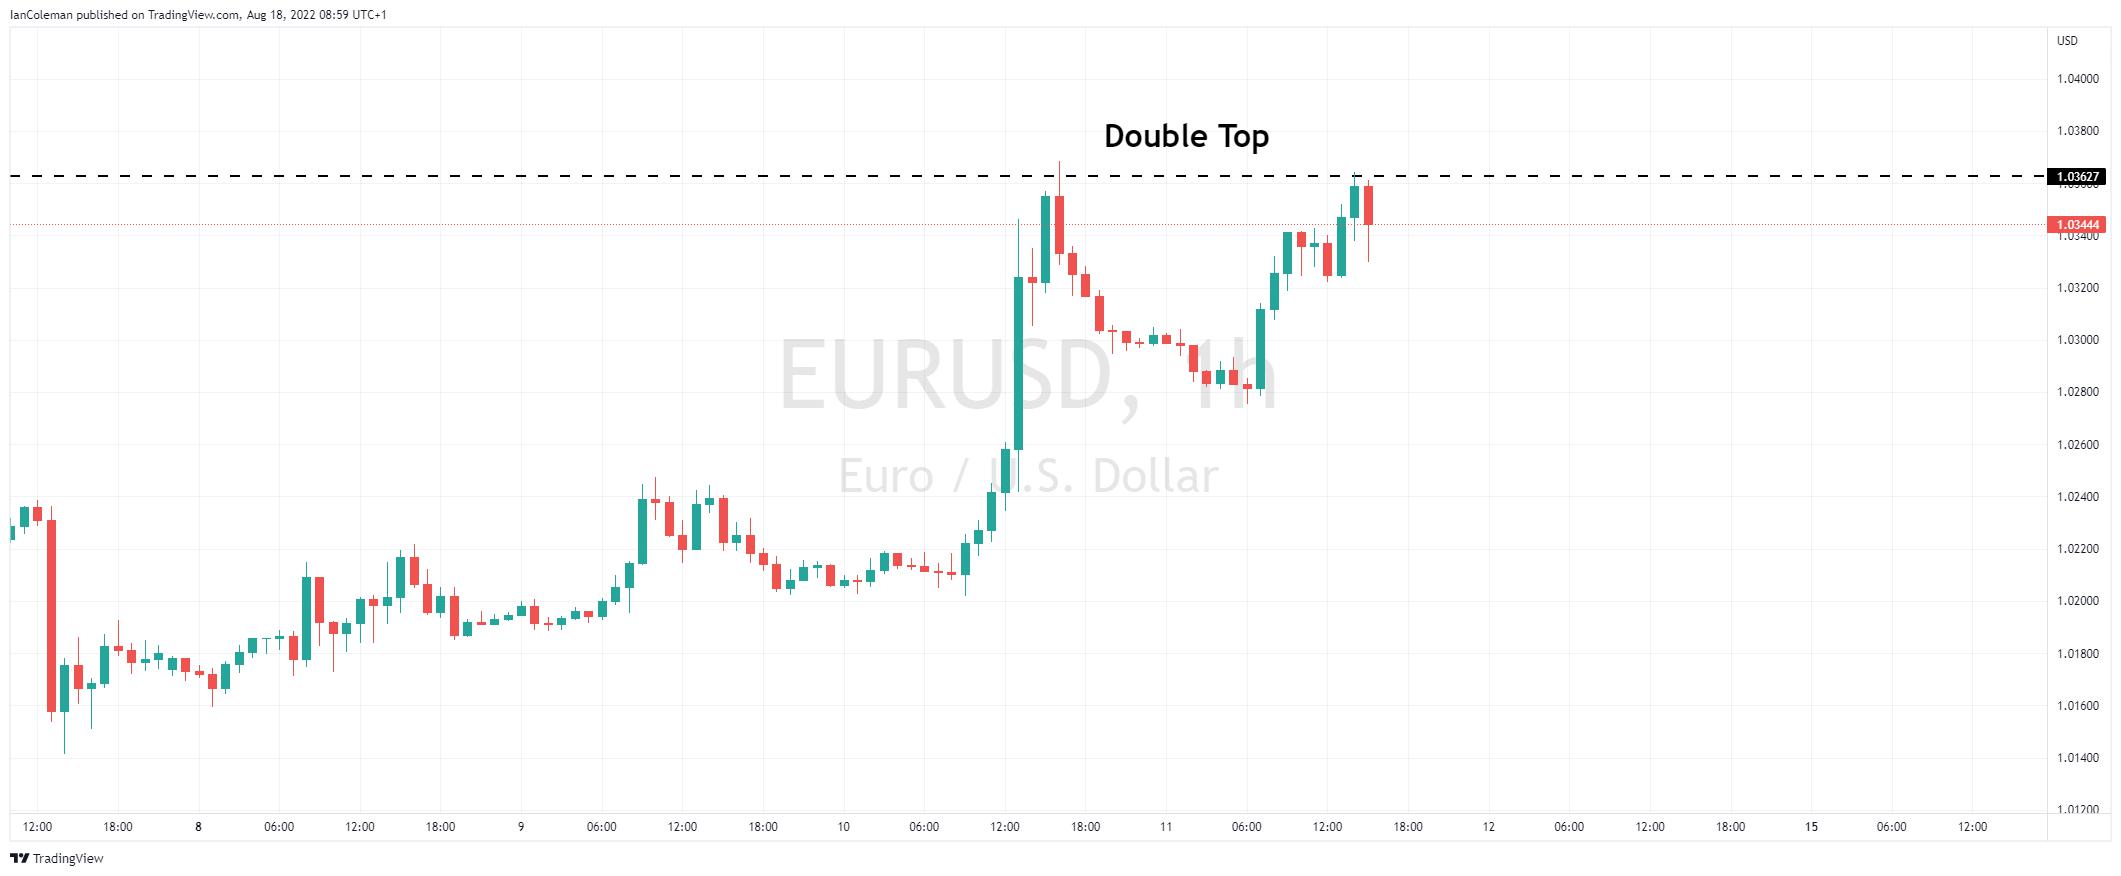
Figure 1 Trading View Double Top

The forex pattern is confirmed with a break of the previous swing low.

The measured move target is the length from the swing high to the swing low. This length is then projected from the swing low, the breakout level.

Preview

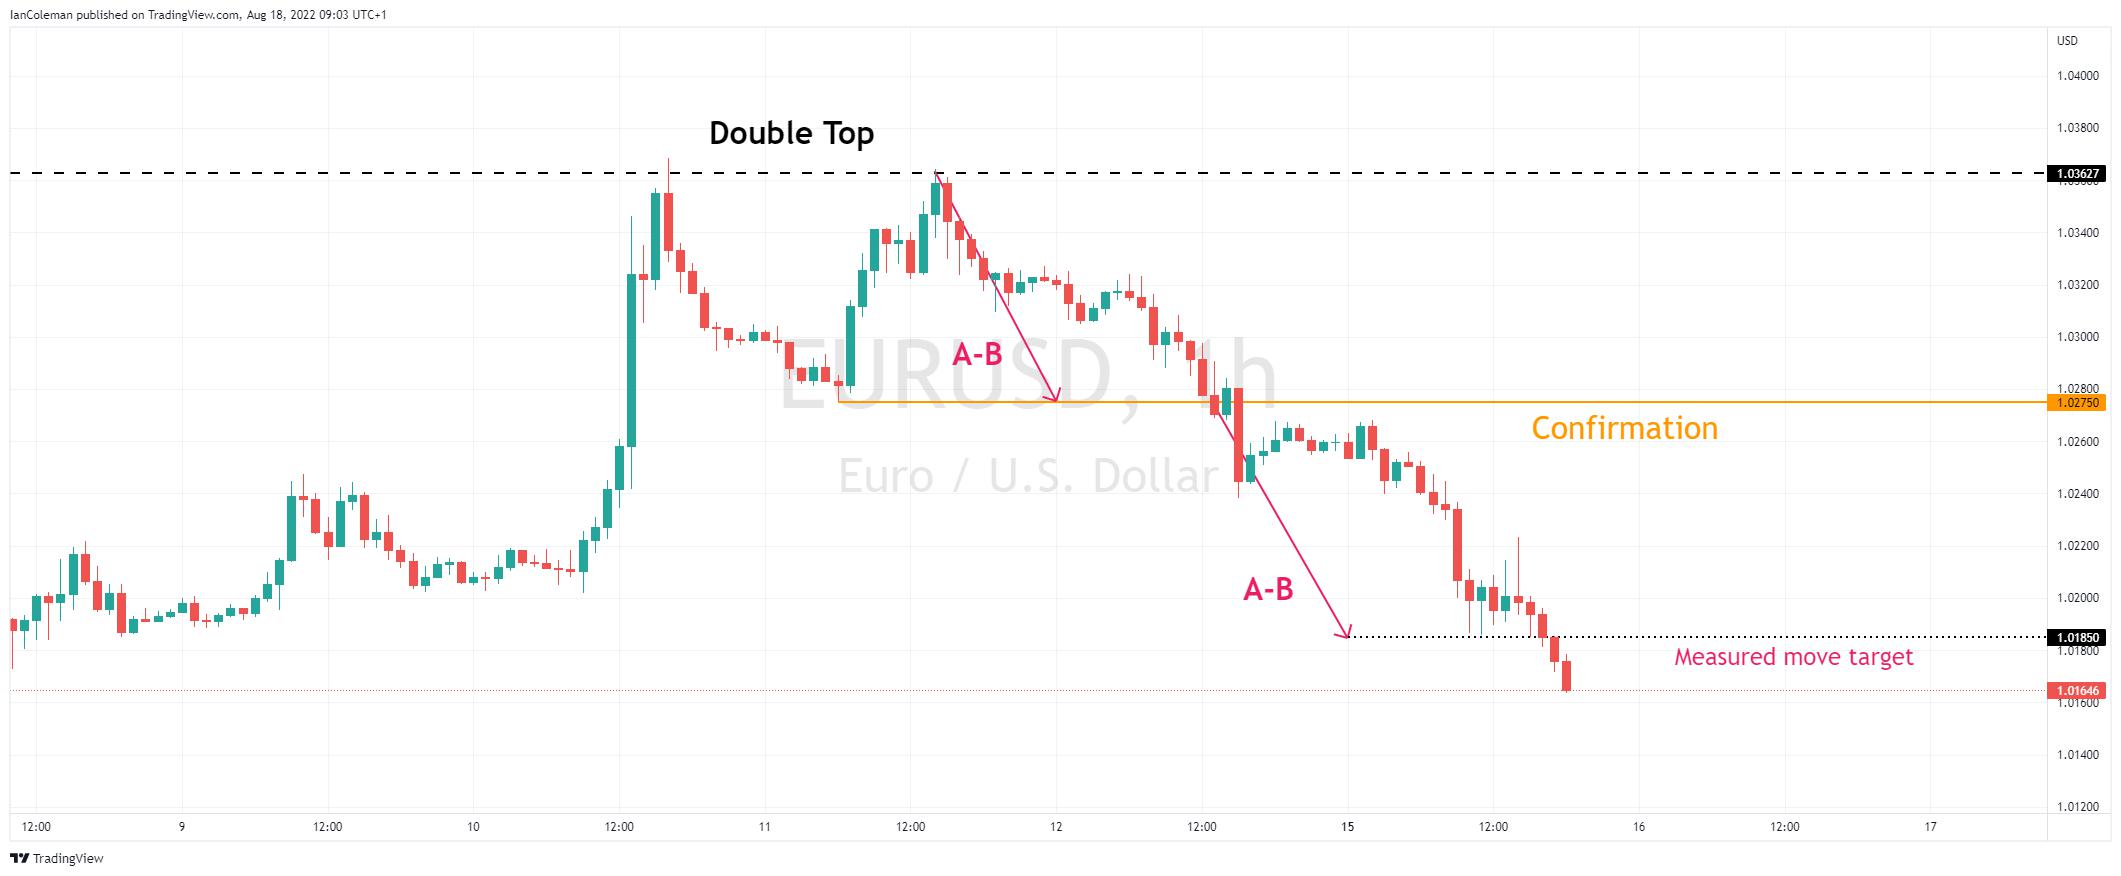
Figure 2 Trading View Double Top confirmation

The treble top forex pattern tests the resistance zone three times. It is sometimes analysed as a Head and Shoulders pattern

Head and Shoulders

A Head and Shoulders forex pattern occurs when a resistance zone is tested three times. Note that buyers manage to push to a new swing high in the 2nd wave of buying but fail to produce a new swing high in the 3rd wave. The subsequent selloffs offer a support line. This is known as the neckline.

Preview

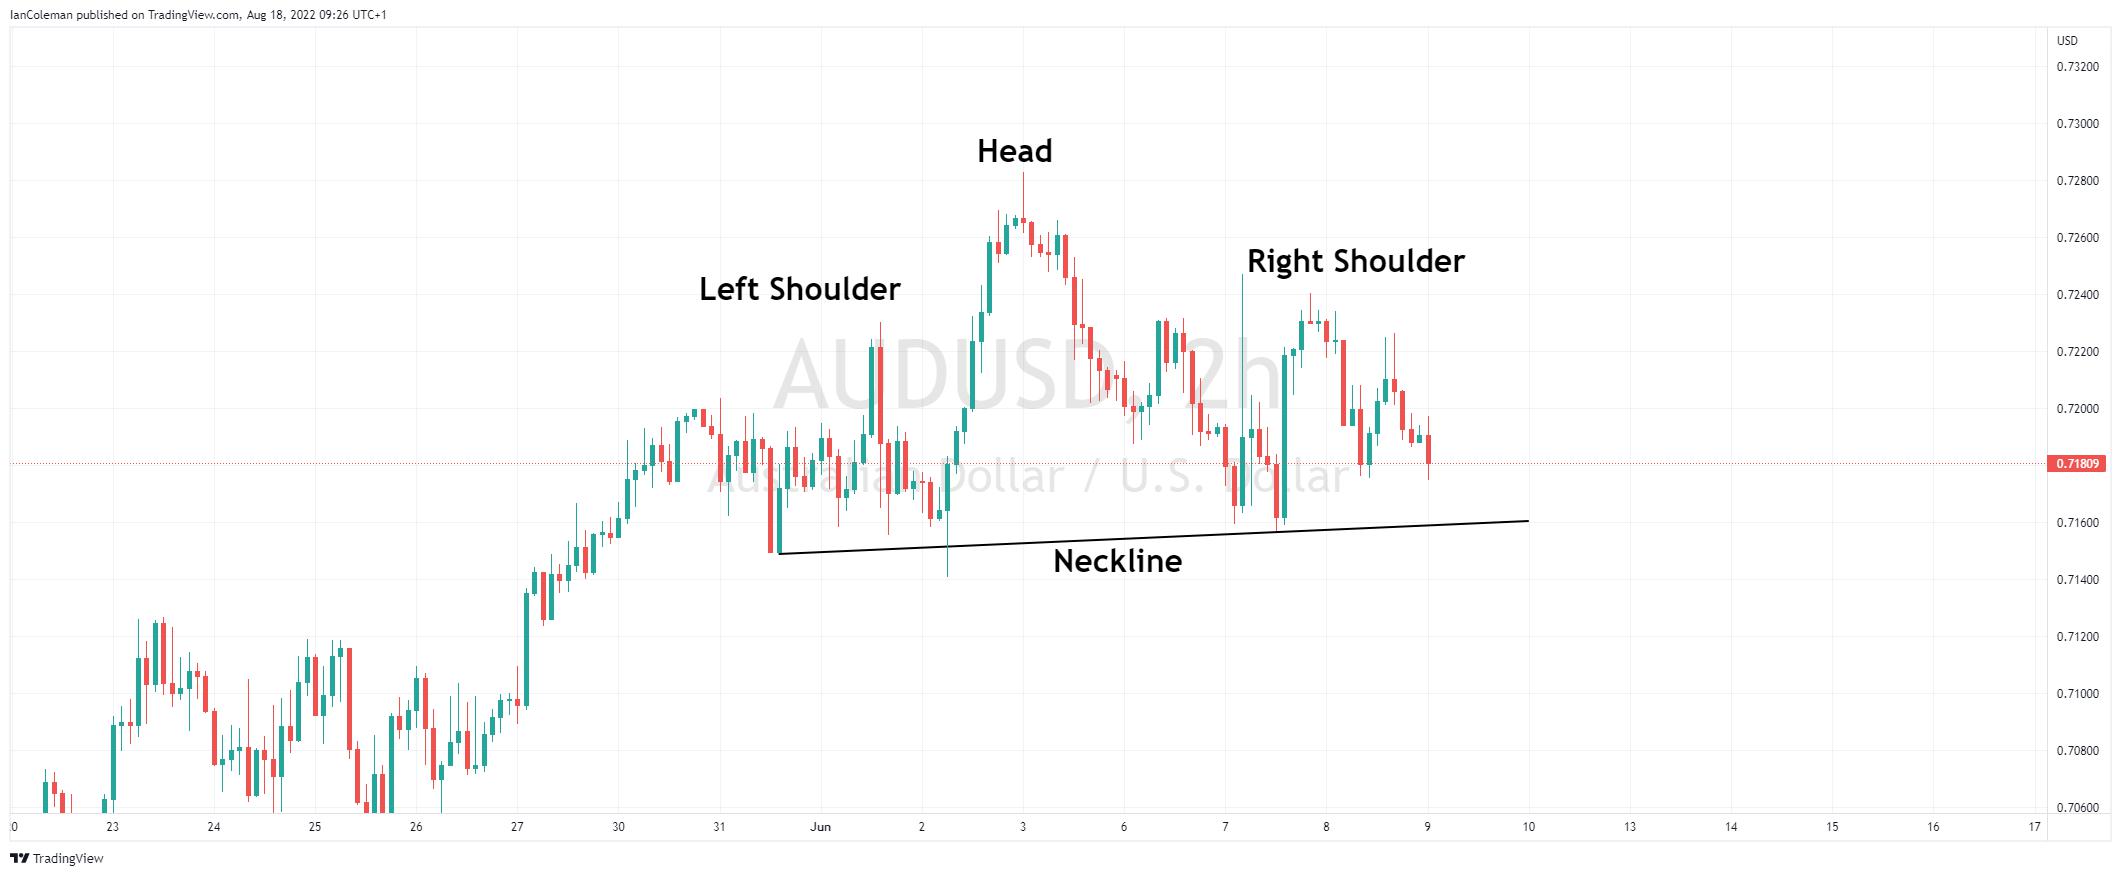
Figure 3 Trading View Head and Shoulders

The forex pattern is confirmed on a break of the neckline. The measured move target is the length from the head to the neckline, projected from the neckline (breakout level).

Preview

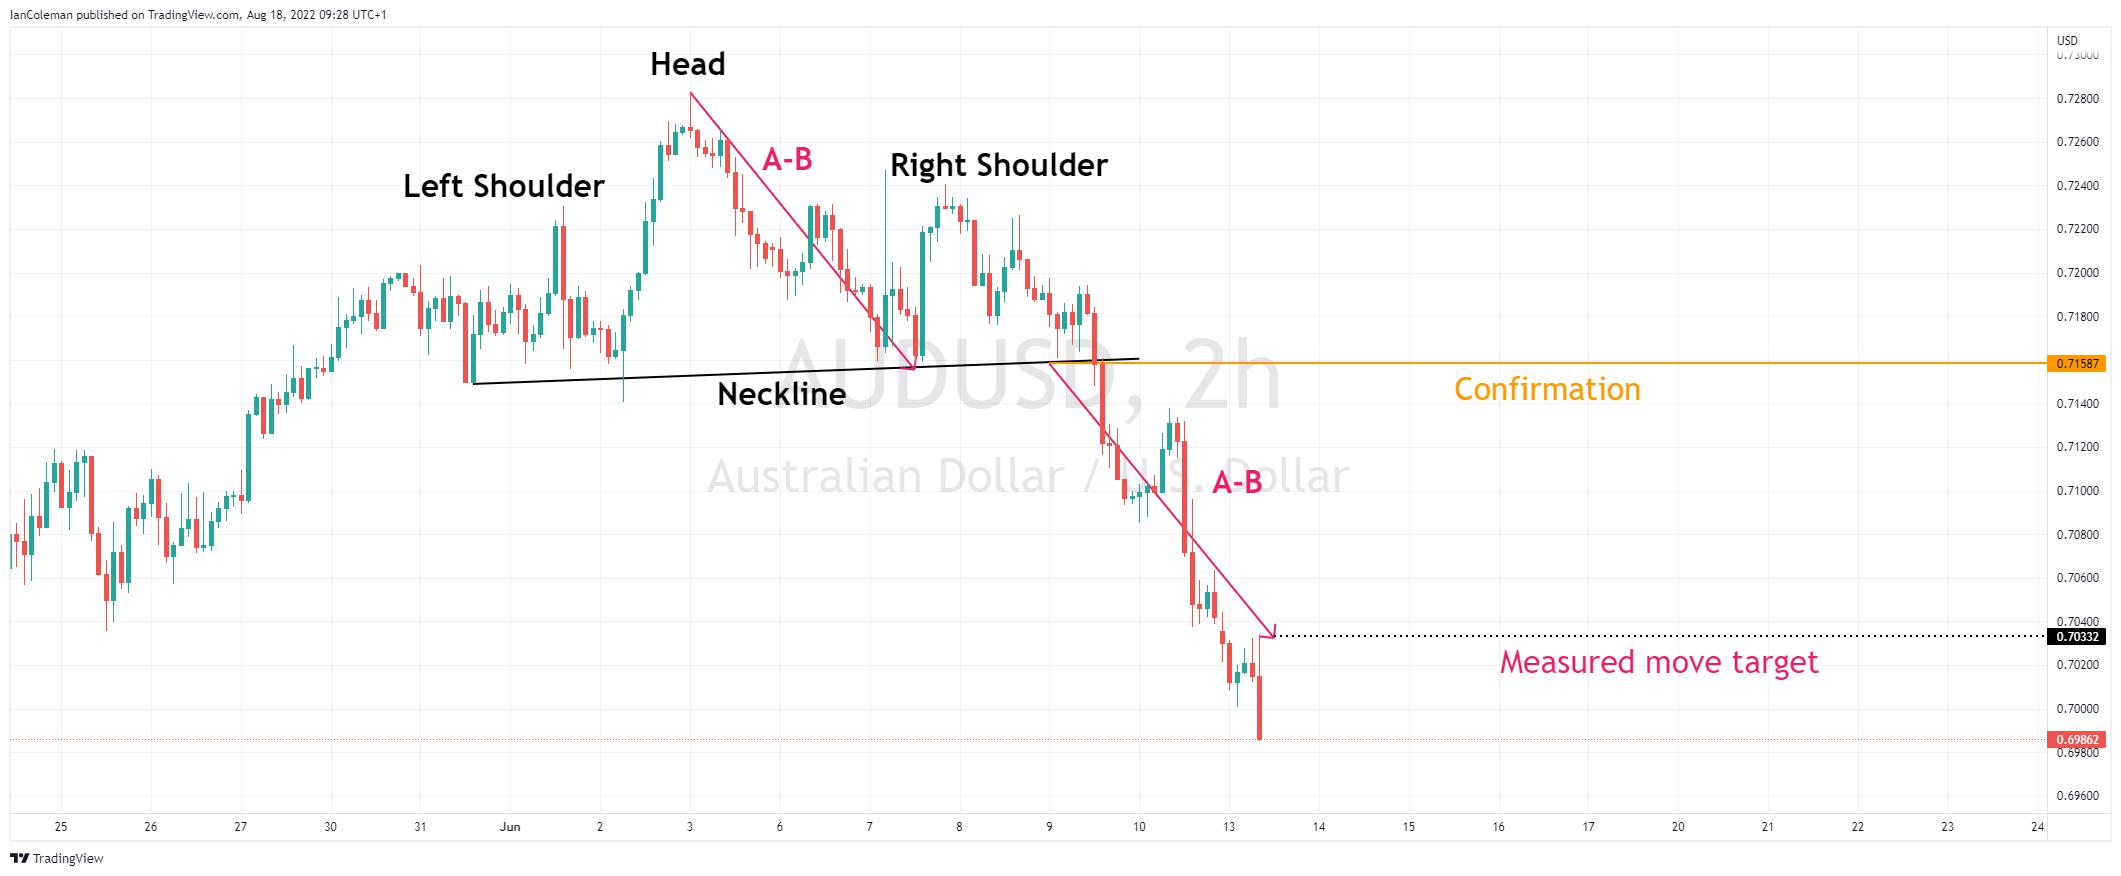
Figure 4 Trading View Head and Shoulders confirmation

Ending Wedge

An ending wedge forex pattern occurs when the market keeps making higher highs and higher lows, but the rallies are losing momentum. This forms a pattern known as a Rising or Ending Wedge.

Preview

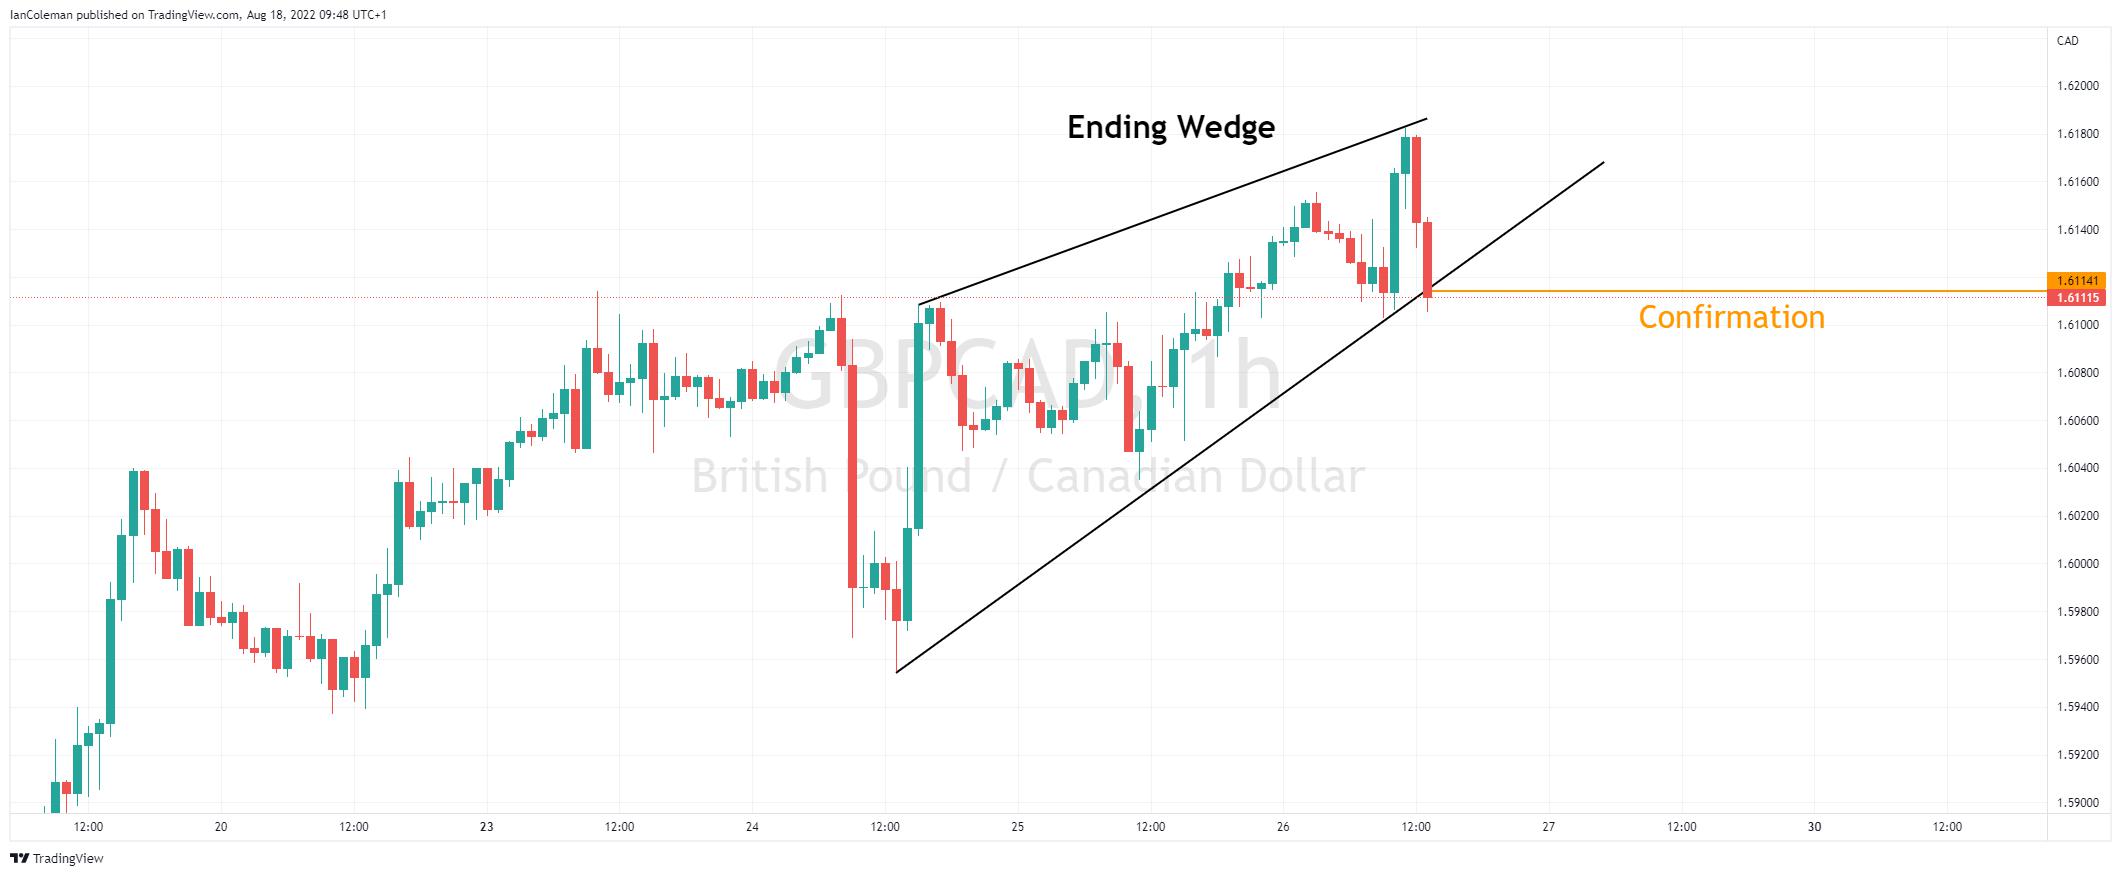
Figure 5 Trading View Ending Wedge

A move through the lower trend line support is confirmation of a breakout. The measured move target is the start of the wedge.

Preview

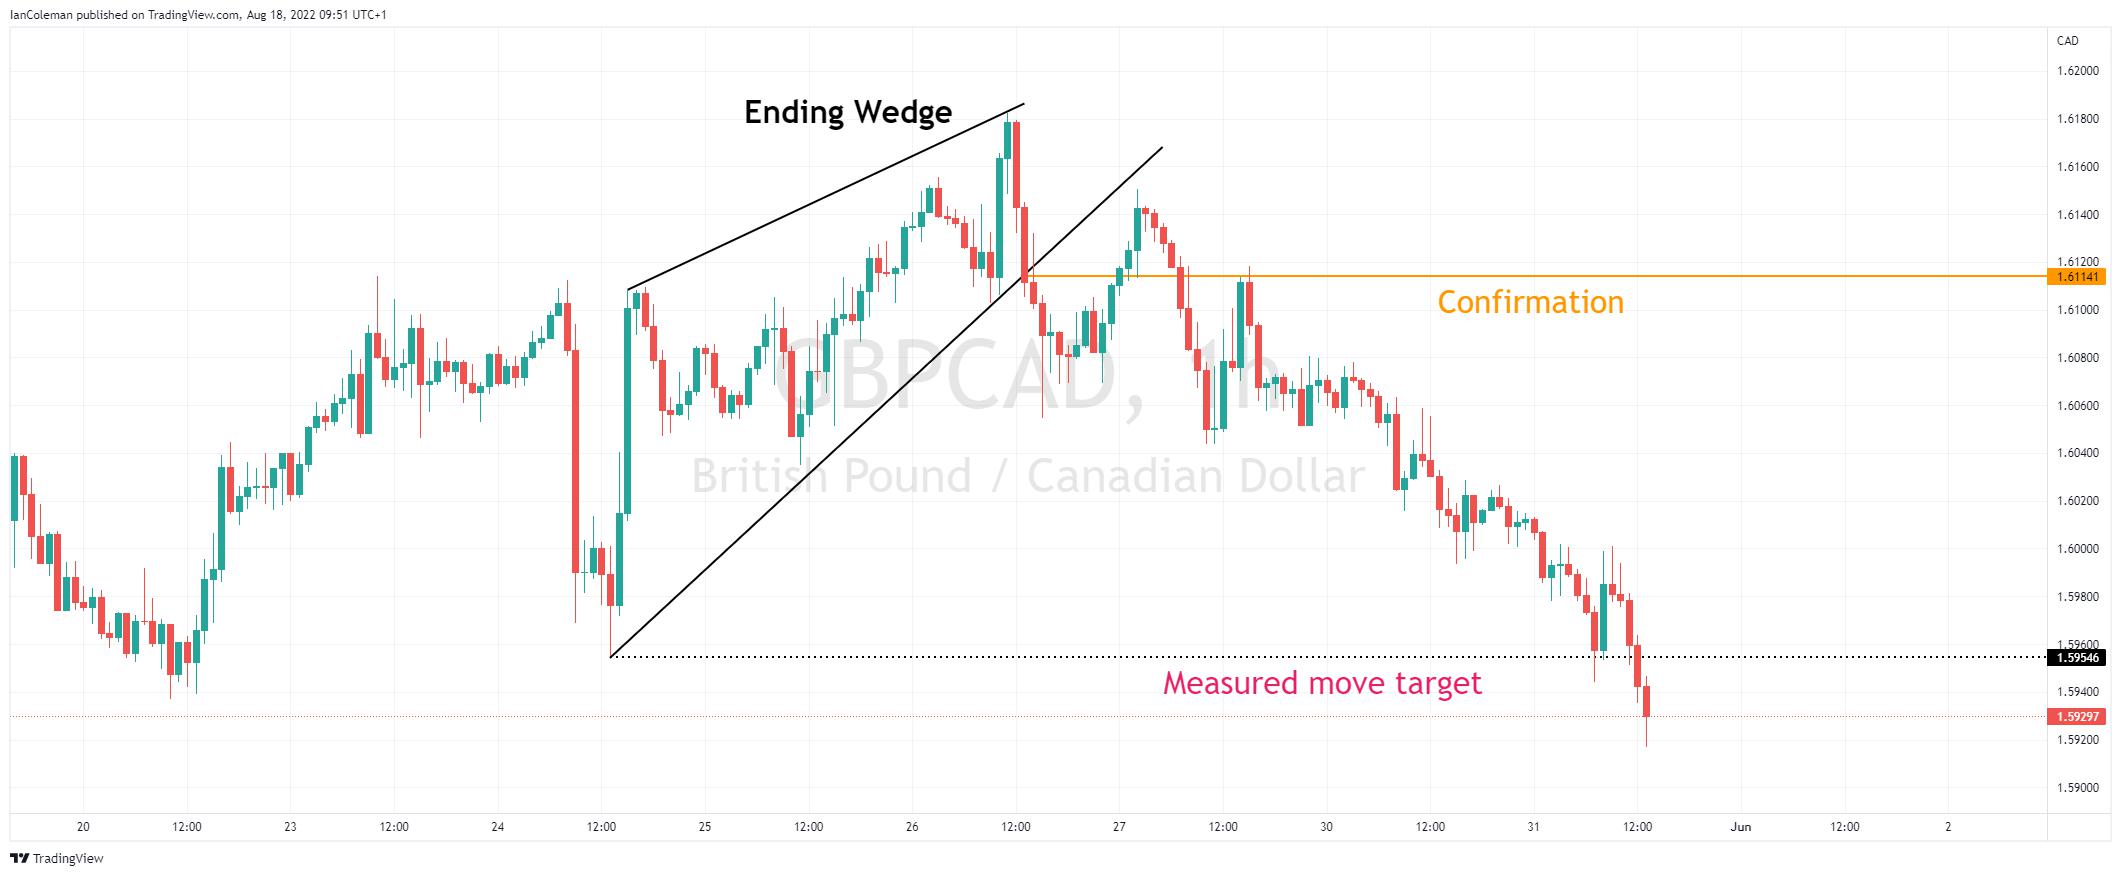
Figure 6 Trading View Ending Wedge confirmation

Continuation patterns

Channel

Trends move in waves. A downward trend forex pattern is highlighted as having lower highs and lower lows. By connecting three points from the swing highs forms a downward channel.

Preview

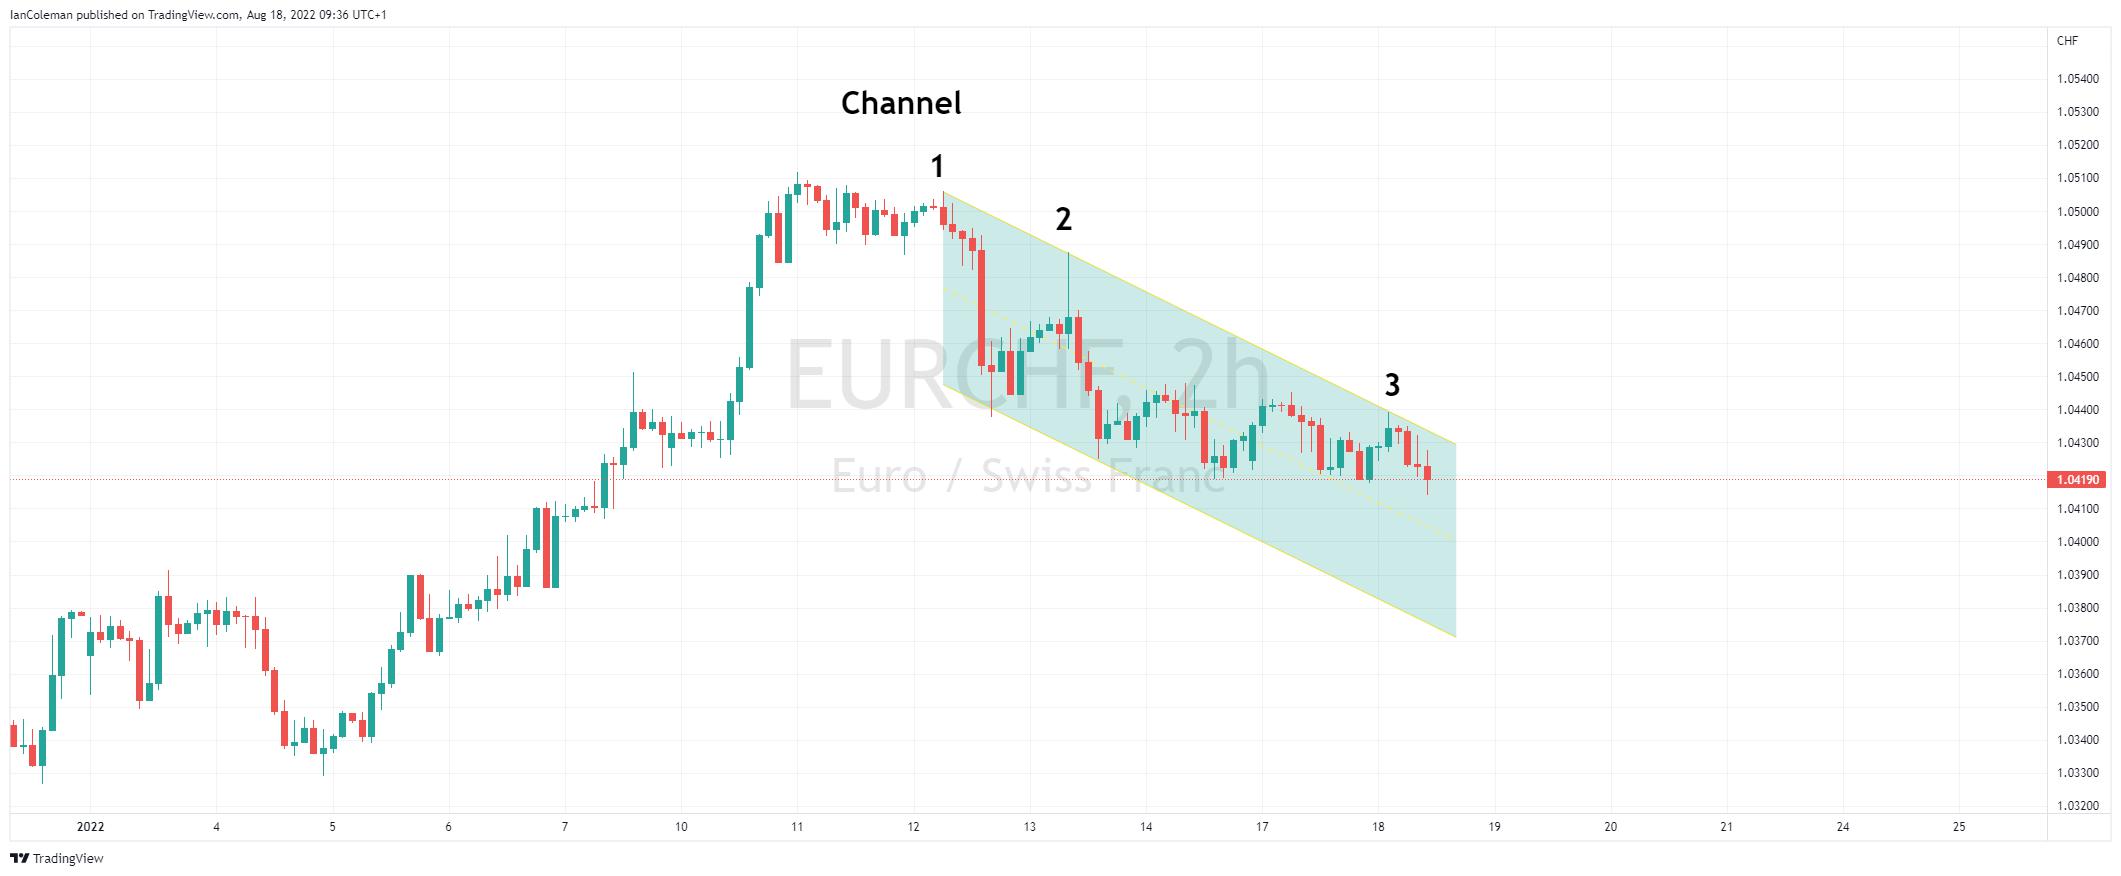
Figure 7 Trading View Channel

If the price action stays within the channel, the negative move continues. A breakout of the channel might suggest a change of trend.

Preview

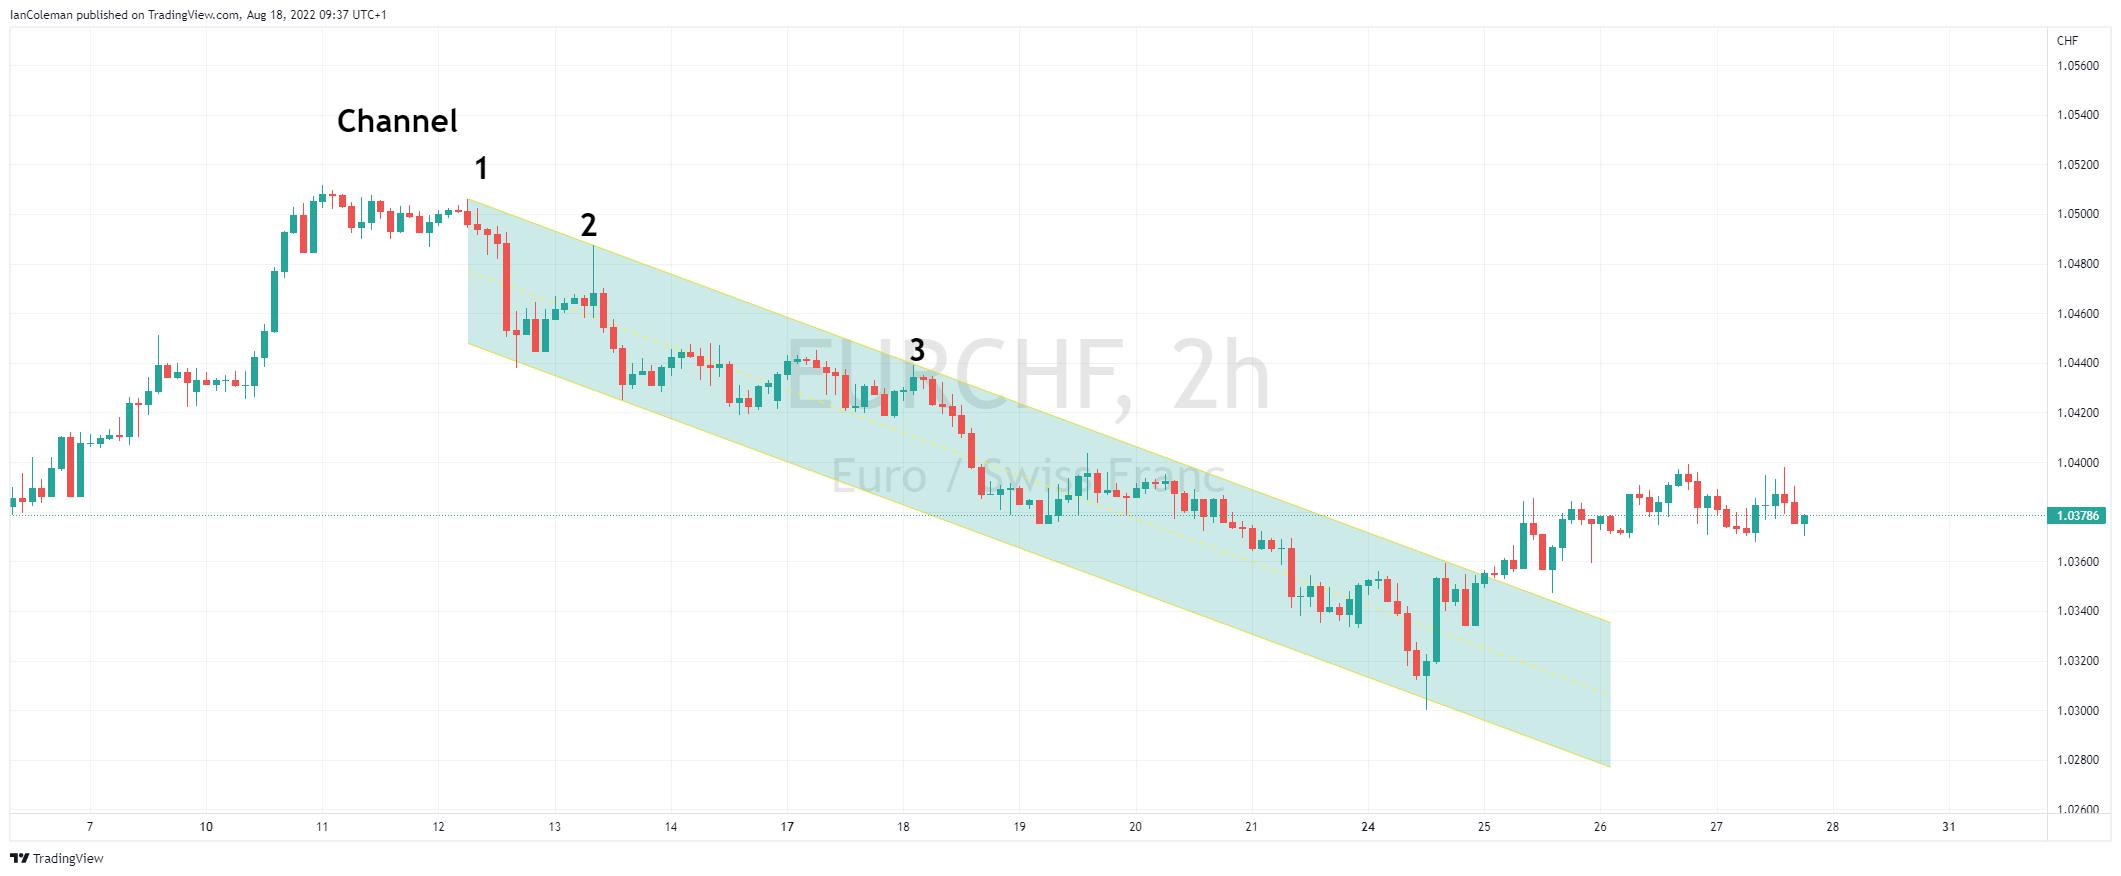
Figure 8 Trading View Channel continuation

Flag or Pennant

A flag or pennant forex pattern occurs when the market has moved aggressively to the downside. This forms the flagpole. We then get a period of consolidation in a sideways motion or mildly against the previous trend. This consolidating period forms the flag.

Preview

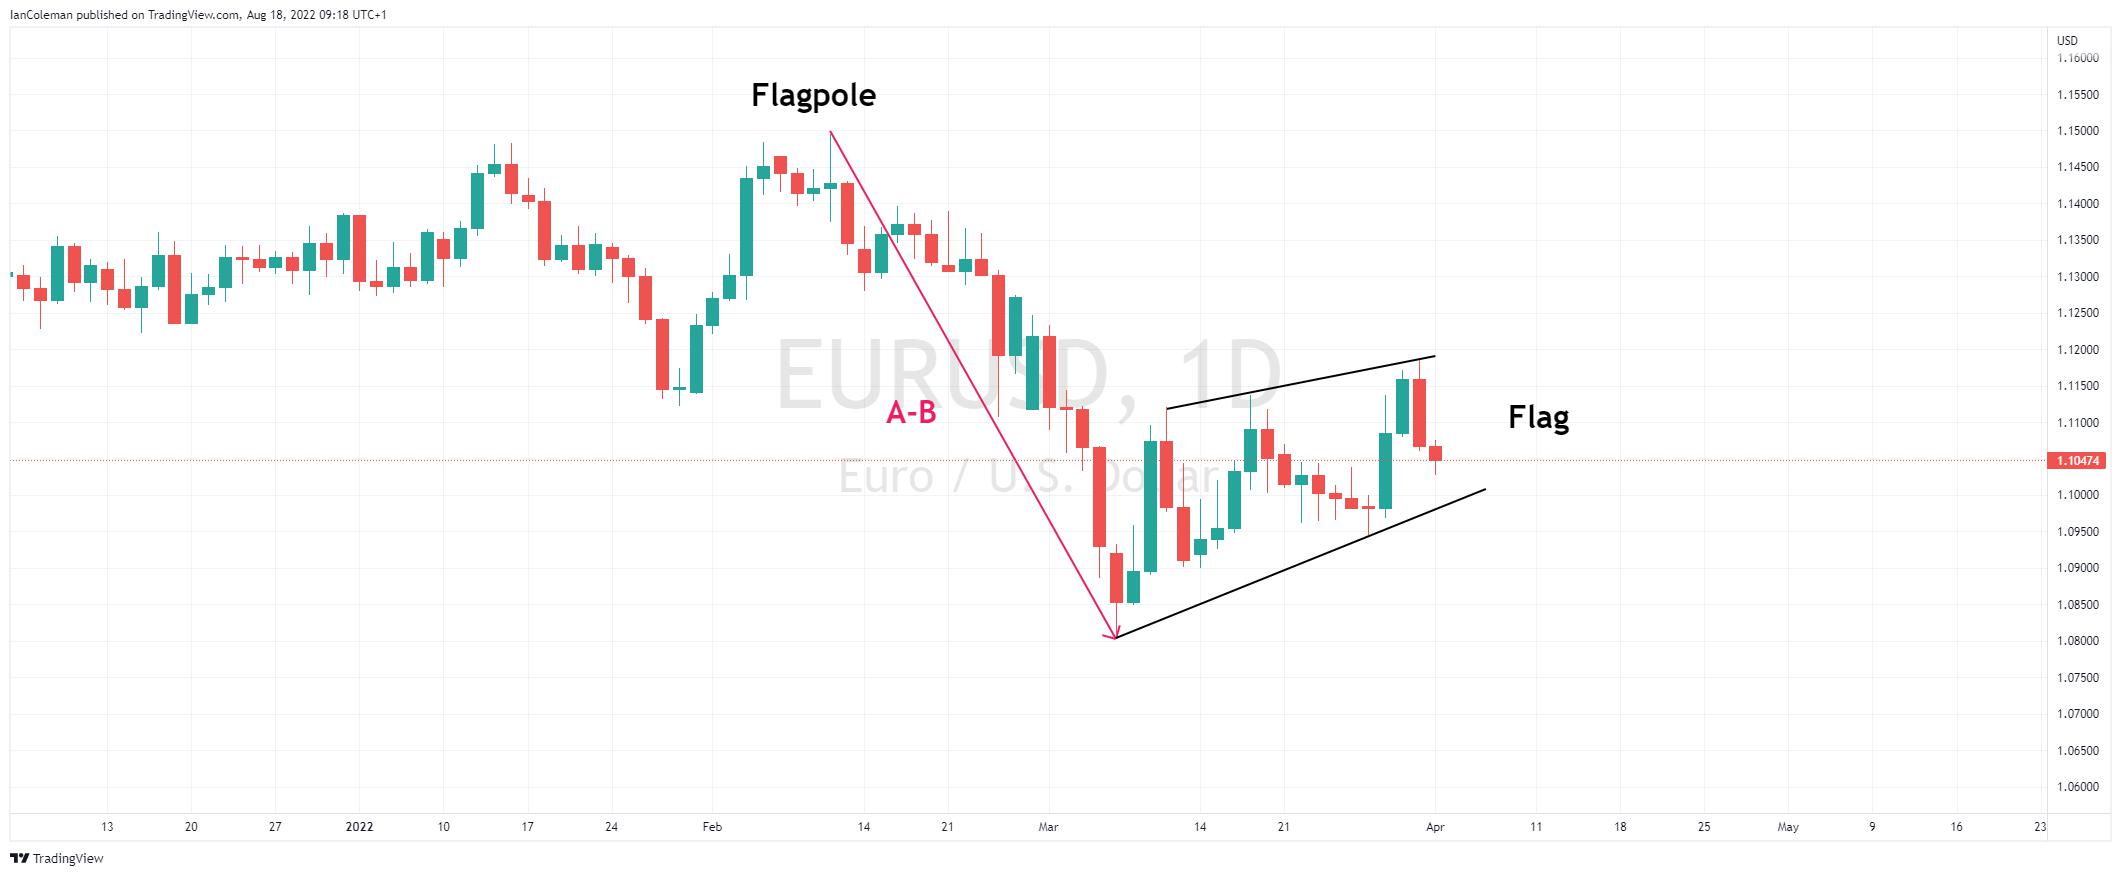
Figure 9 Trading View Flag

A breakout of the flag is needed to confirm the original trend is back underway. The measured move target is the length of the flagpole projected from the highest point of the flag.

Preview

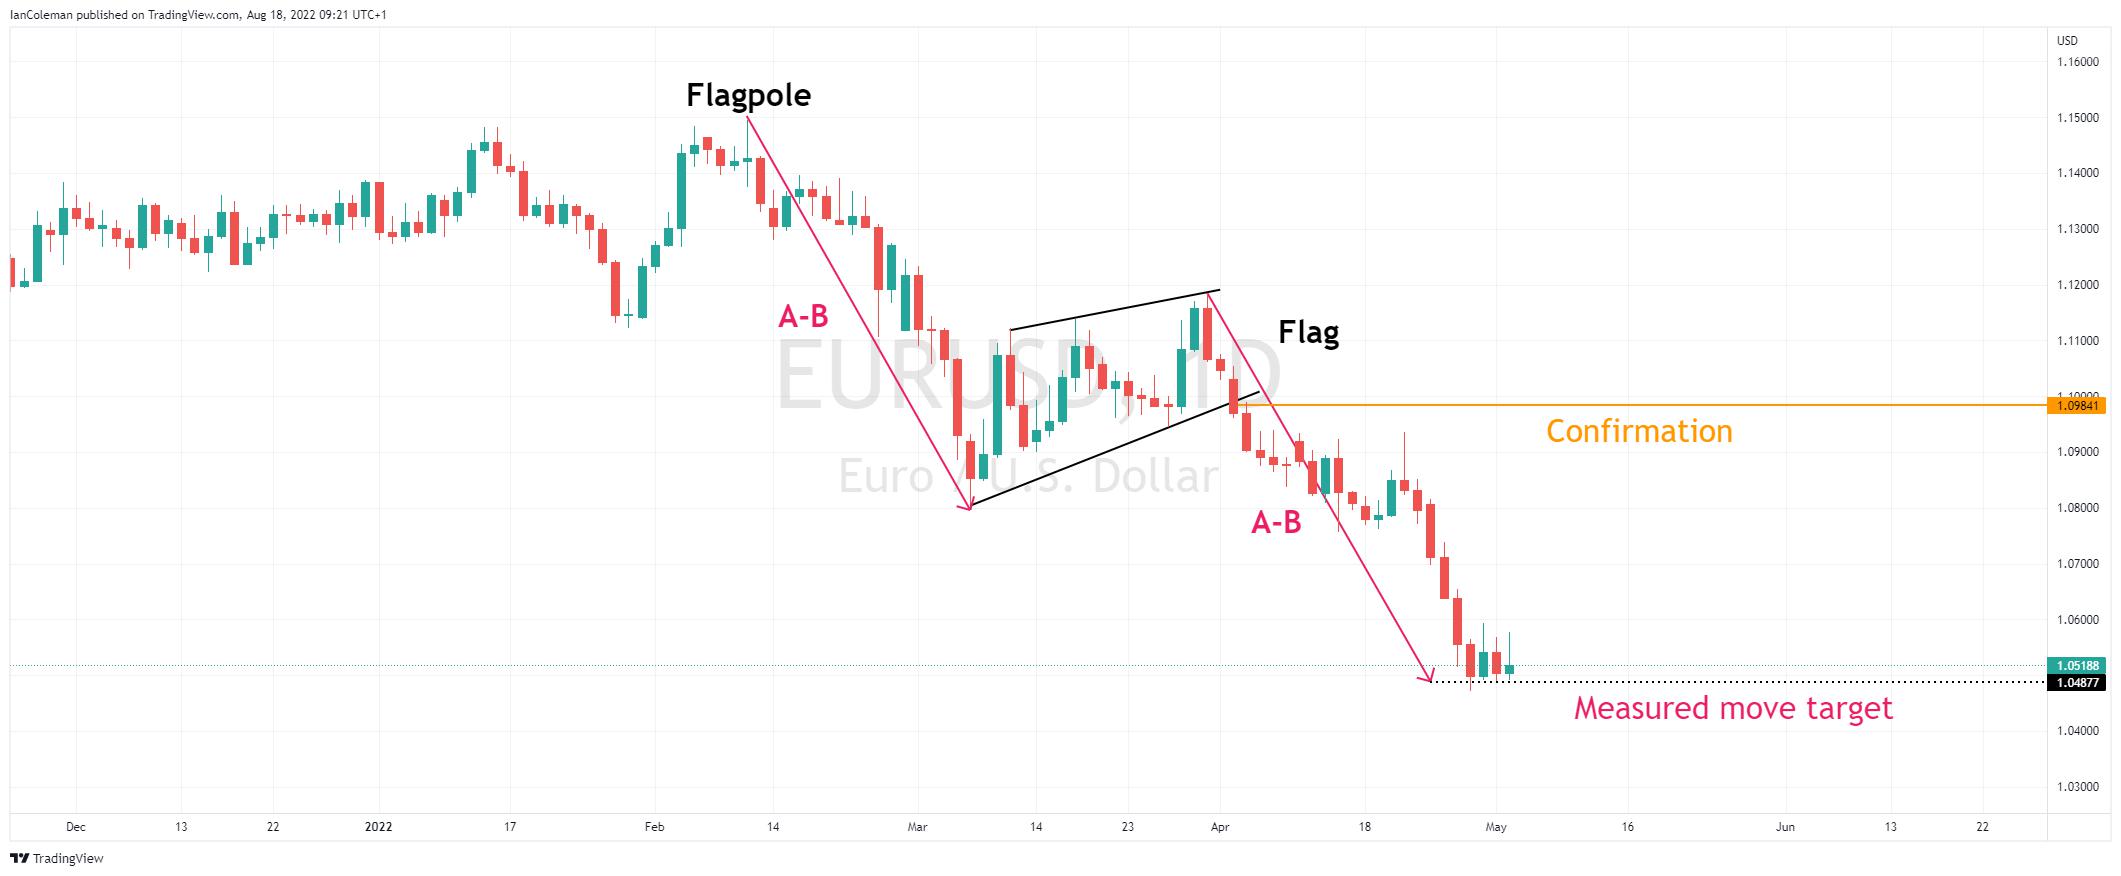
Figure 10 Trading View Flag confirmation

Triangle

A bearish triangle forex pattern occurs when the market hits a solid area of support. Sellers continue to emerge at lower levels. These lower highs form the side of the triangle.

Preview

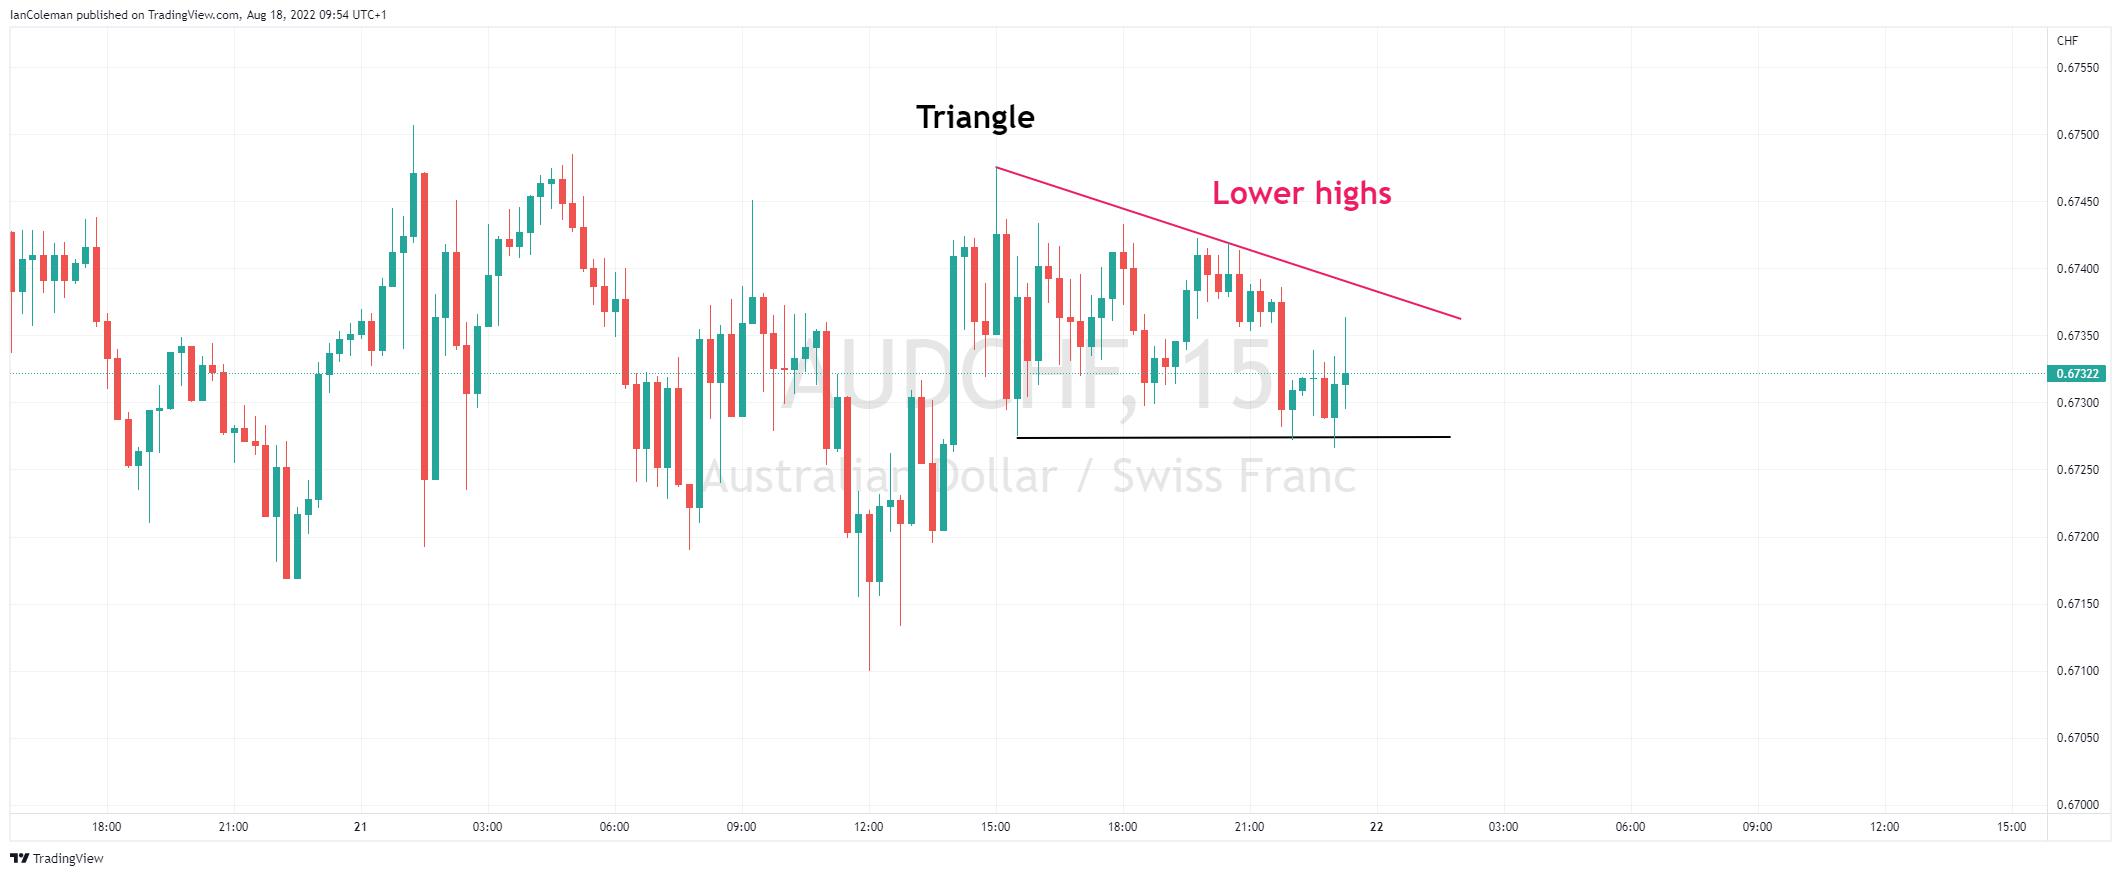
Figure 11 Trading View Triangle

A break of support and the measured move is calculated by taking the highest point of the triangle, to the support, and projecting this from the breakout level.

Preview

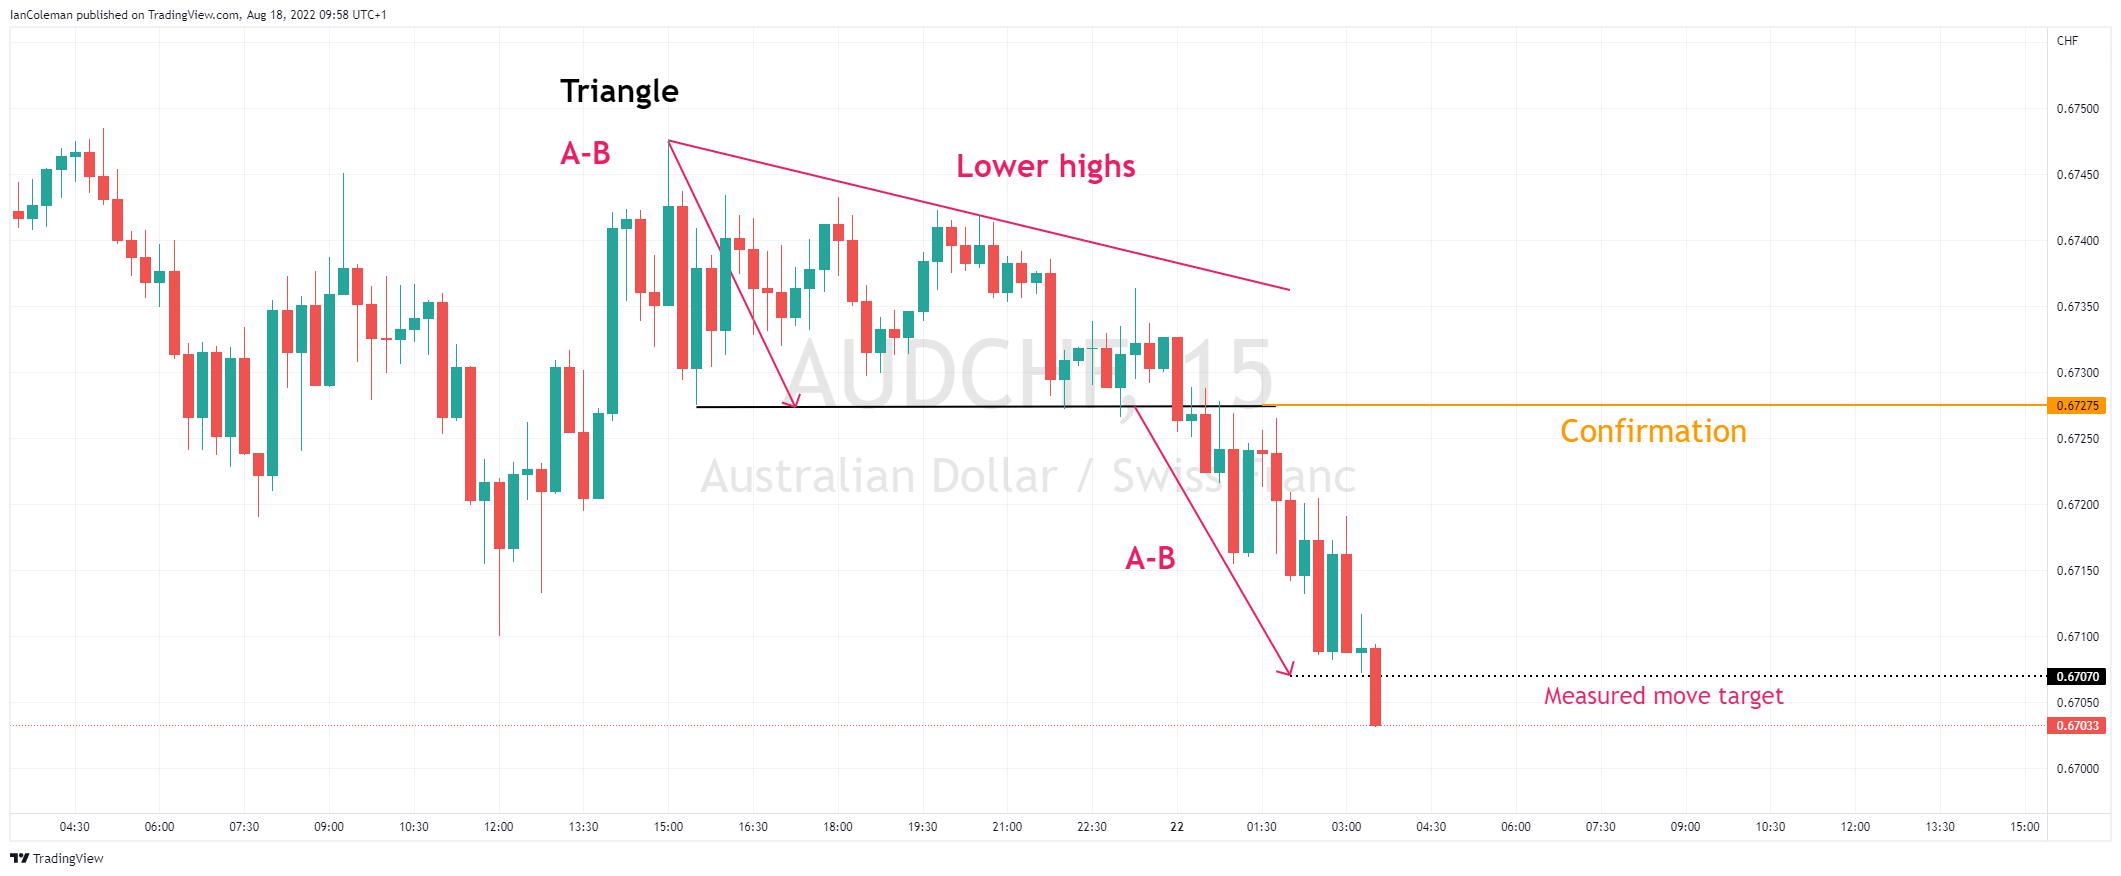
Figure 12 Trading View Triangle confirmation


Related articles

What is 20 pips in Forex?

What is 20 pips in Forex?

EUR
USD
What are the different types of Forex traders?

What are the different types of Forex traders?

Trading
Forex
Pepperstone doesn’t represent that the material provided here is accurate, current or complete, and therefore shouldn’t be relied upon as such. The information provided here, whether from a third party or not, isn’t to be considered as a recommendation; or an offer to buy or sell; or the solicitation of an offer to buy or sell any security, financial product or instrument; or to participate in any particular trading strategy. We advise any readers of this content to seek their own advice. Without the approval of Pepperstone, reproduction or redistribution of this information isn’t permitted.

Autres sites

  • The Trade Off
  • Partenaires
  • Groupe
  • Carrières

Façons de commercer

  • La tarification
  • Caractéristiques de nos Comptes
  • Comptes de négociation
  • Pro
  • Heures de négociation

Plateformes

  • Plateformes de négociation
  • Outils de trading

Marchés et symboles

  • Forex
  • CFD sur actions
  • ETF CFDs
  • CFD Indices
  • Matières premières
  • CFD sur les indices de devises
  • CFD à terme

Analyse

  • Naviguer sur les marchés
  • Le Daily Fix
  • Pepperstone Pulse
  • Rencontrez les analystes

Apprenez à trader

  • Guides de trading
  • Vidéos
  • Séminaires en ligne
Pepperstone logo
support@pepperstone.com
+44 (800) 0465473
195, Makarios III Avenue, Neocleous House,
3030, Limassol Cyprus
  • Documentation juridique
  • Politique de confidentialité
  • Conditions générales d’utilisation du site Internet
  • Politique en matière de cookies

© 2025 Pepperstone EU Limited
Company Number ΗΕ 398429 | Cyprus Securities and Exchange Commission Licence Number 388/20

Avertissement sur les risques : Les CFD sont des instruments complexes et comportent un risque élevé de perte d'argent rapide en raison de l'effet de levier. 75.3% des comptes des investisseurs particuliers perdent de l'argent lorsqu'ils négocient des CFD. Vous devez vous demander si vous comprenez le fonctionnement des CFD et si vous pouvez vous permettre de prendre le risque élevé de perdre votre argent.

Les transactions sur le Compte CFD Risque Limité sont un type de transaction avec effet de levier et avec un stop loss garanti lié à chaque position. Ces produits présentent un caractère spéculatif et un risque élevé de perte totale du capital investi.


La négociation de produits dérivés est risquée. Il ne convient pas à tout le monde et, dans le cas des clients professionnels, vous pouvez perdre beaucoup plus que votre investissement initial. Vous ne possédez pas ou n'avez pas de droits sur les actifs sous-jacents. Les performances passées ne préjugent pas des performances futures et les lois fiscales sont susceptibles de changer. Les informations contenues dans ce site sont de nature générale et ne tiennent pas compte de vos objectifs personnels, de votre situation financière ou de vos besoins. Veuillez lire nos documents juridiques et vous assurer que vous comprenez parfaitement les risques avant de prendre toute décision de trading. Nous vous encourageons à demander un avis indépendant.

Pepperstone EU Limited est une société à responsabilité limitée enregistrée à Chypre sous le numéro ΗΕ 398429. Elle est autorisée et réglementée par la Cyprus Securities and Exchange Commission (numéro de licence 388/20). Siège social : 195, Makarios III Avenue, Neocleous House, 3030, Limassol, Chypre.

Les informations contenues dans ce site ne sont pas destinées aux résidents de la Belgique ou des États-Unis, ni à une utilisation par une personne dans un pays ou une juridiction où une telle distribution ou utilisation serait contraire à la législation ou à la réglementation locale.