- Français
- English
- Español
- Italiano
What is the definition of the All Ords?
All Ords is an abbreviation for All Ordinaries, the oldest index in Australia. The short code is XAO. Covering 480 of the largest Australian Securities Exchange (ASX), all Ords is considered a great barometer for the Australian Stock Market.
The largest company by market cap is The Commonwealth Bank and holds a weight of 6.74% of the XAO index.
The financial sector is by far the largest, weighing in at 26.99% of the XAO.
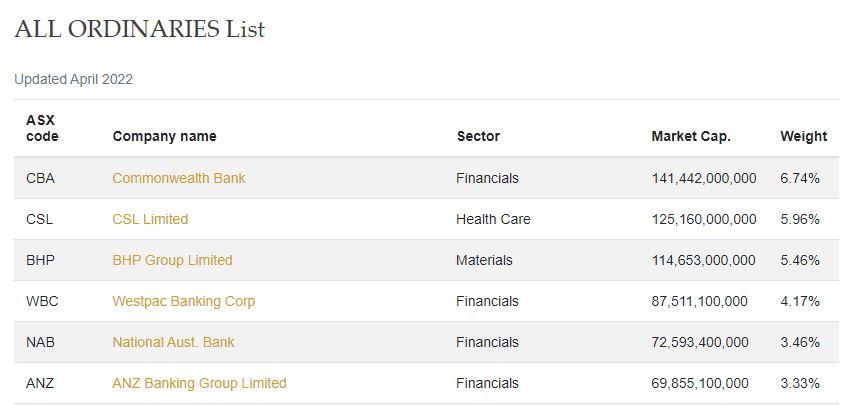
Figure 1 stockmetric.net market cap
The All Ords was set in 1980 with a starting level of 500. In its 42-year lifespan it reached the dizzy heights of 7956 in January 2022. That is an incredible 1491% increase from the launch.
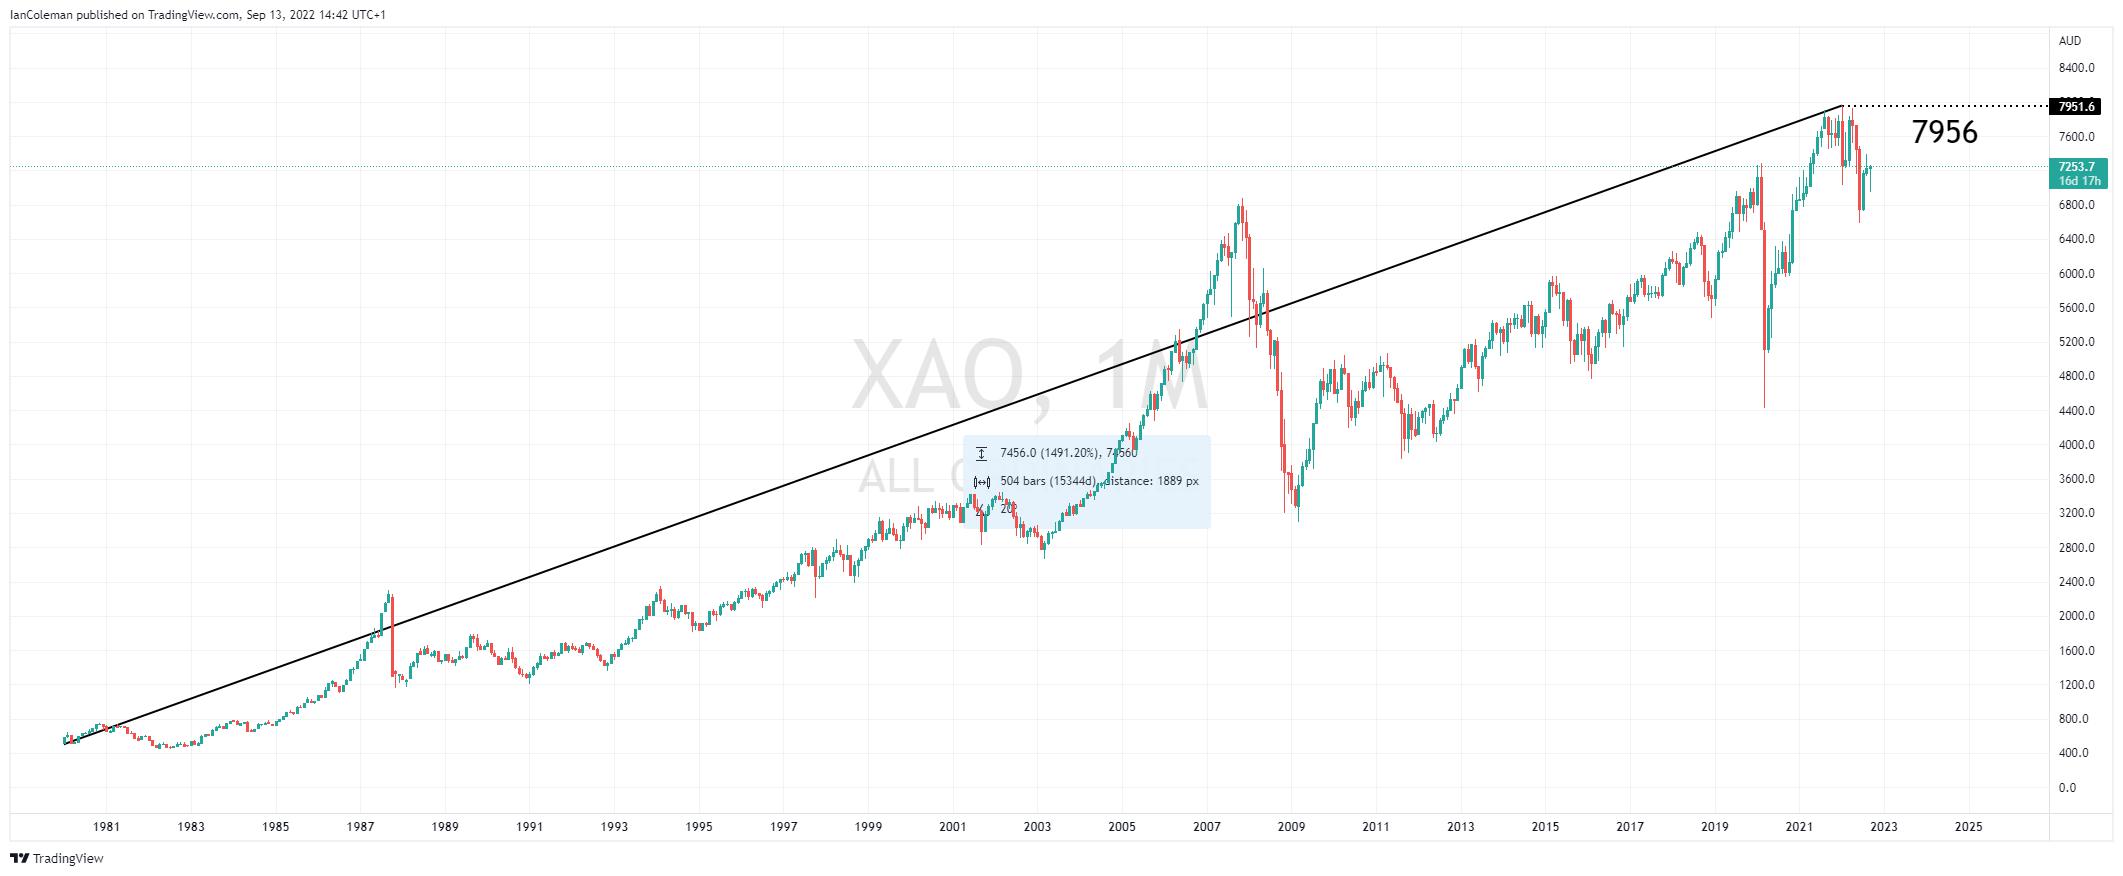
Figure 2 Trading View XAO 1491% increase
Heavily weighted in Banks
We have already mentioned that the All Ords is heavily weighted towards banks and the financial sector. This becomes clearer when we look at an overlay chart highlighting the sustained rally from the 2020 lows.
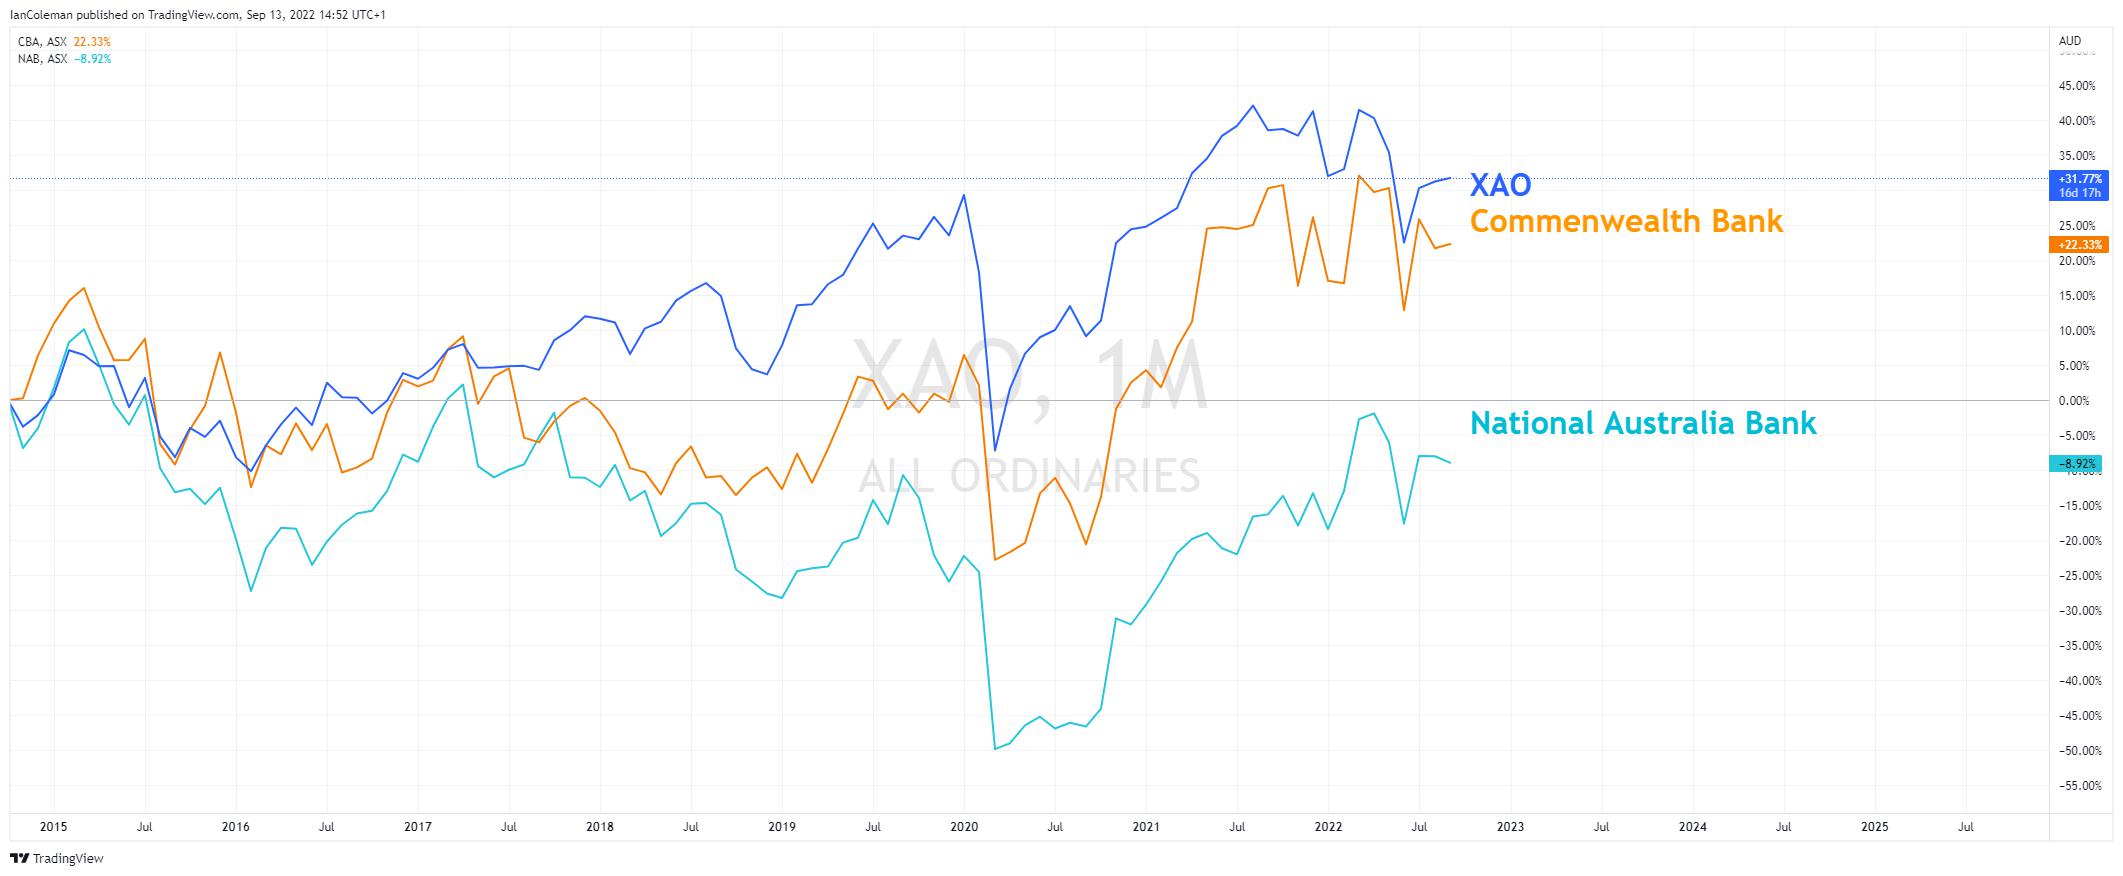
Figure 3 Trading View XAO overlay financial sector
A breakdown of the performance from a technical perspective
A look at the weekly chart and we can note an Expanding Wedge pattern that has a bias to break to the upside. We must express a word of caution here. The measured move target for a wedge breakout is the start of the wedge.
In this scenario, that would take the All Ords mildly higher through the break line to a target level of 7956, possibly forming a double top.
We can also clearly see that levels close to the 7900 Big Figures continue to attract sellers in August 2021, and January and April of 2022.
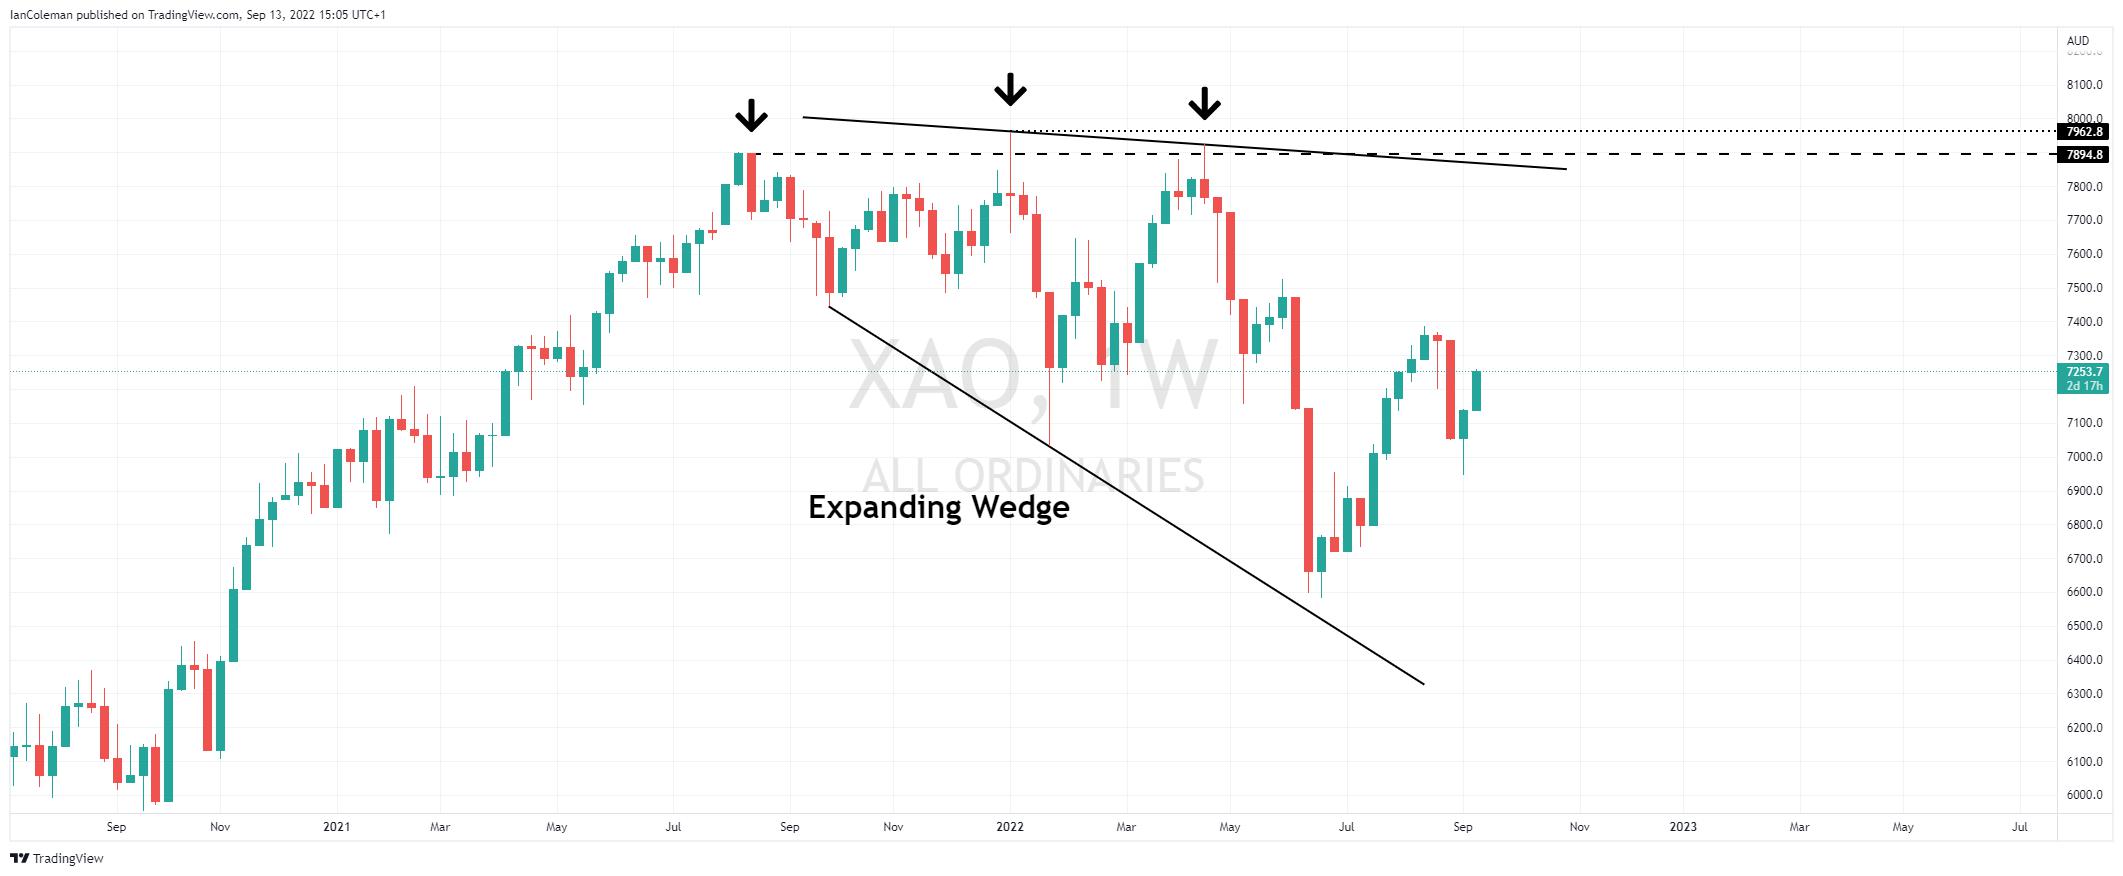
Figure 4 Trading View Weekly Expanding Wedge
Breaking down to the daily chart and as long as the 7386 swing high from the 16th August holds back the bulls, then a more potentially rewarding support zone would be 6678-6666. This would then form a bullish cypher pattern knows as a Bat formation.
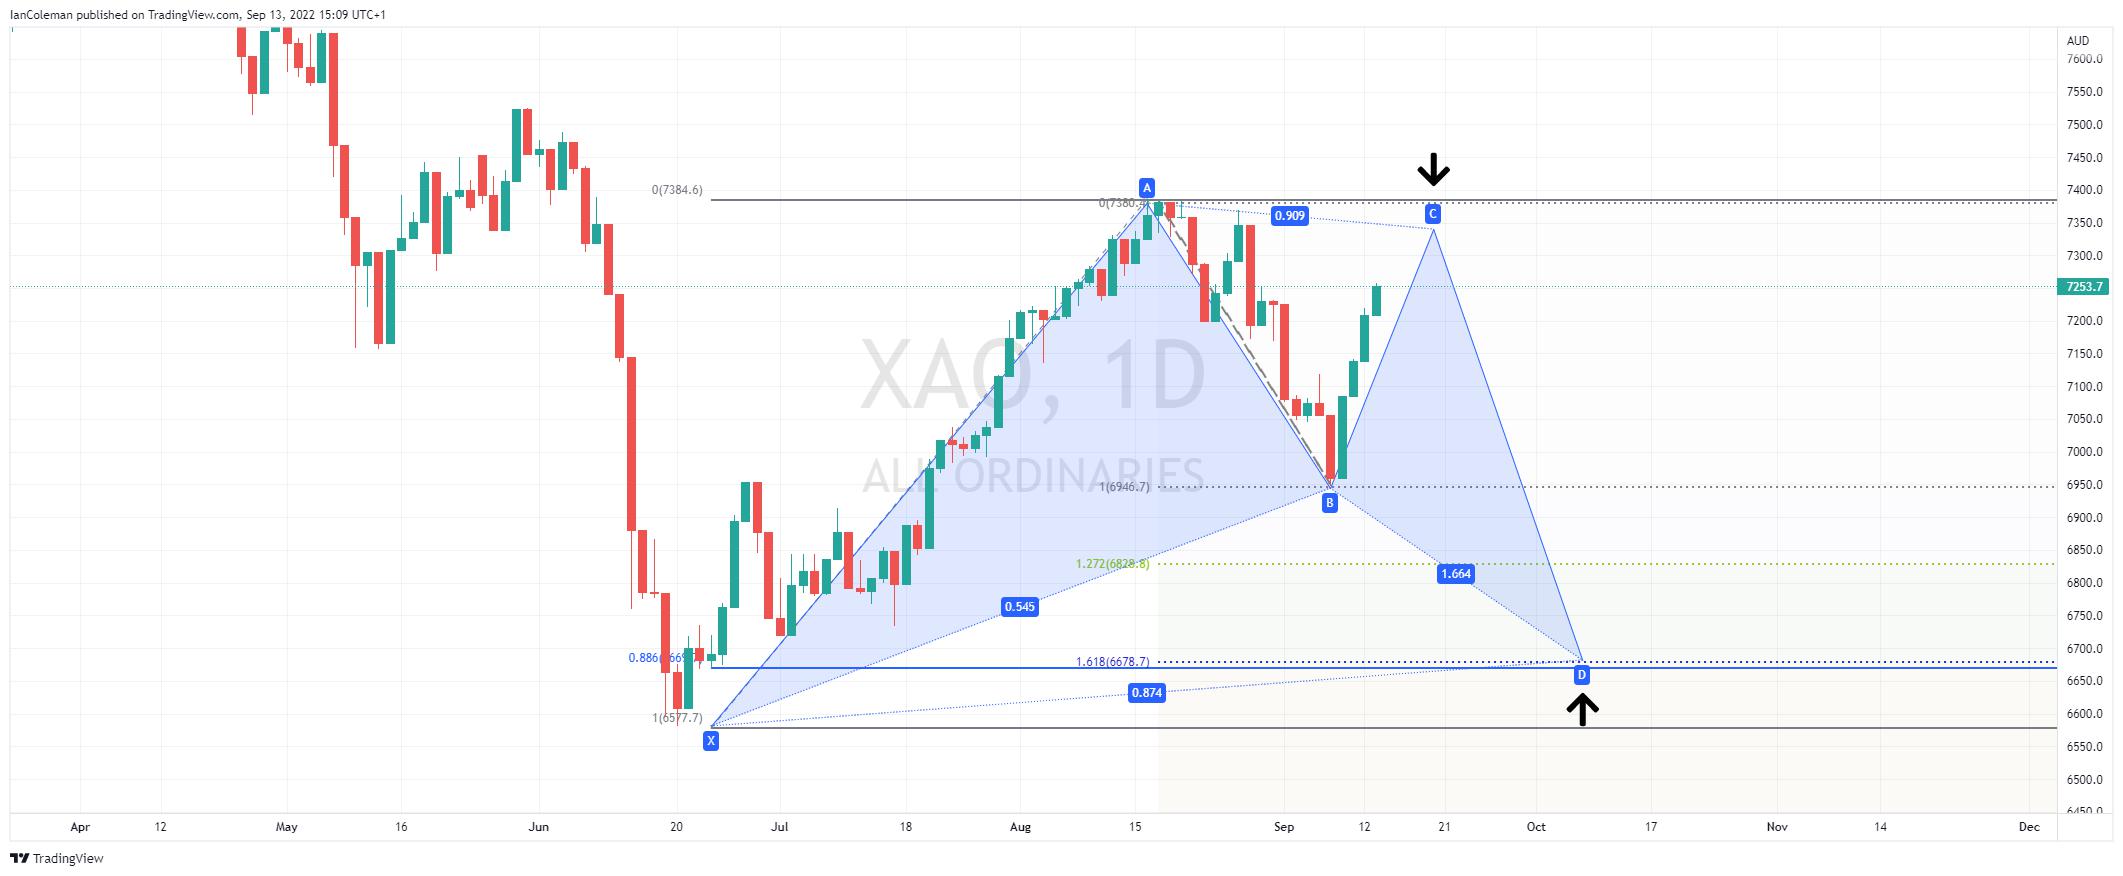
Figure 5 Trading View XAO potential BAT support