差价合约(CFD)是复杂的工具,由于杠杆作用,存在快速亏损的高风险。80% 的散户投资者在于该提供商进行差价合约交易时账户亏损。 您应该考虑自己是否了解差价合约的原理,以及是否有承受资金损失的高风险的能力。
EURUSD – ‘hold the line’
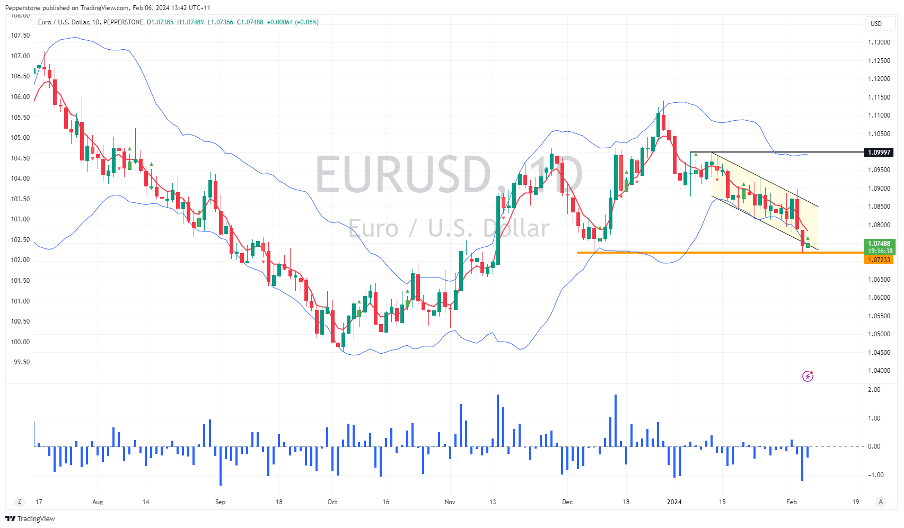
As US economic data continues to come in above expectations and Fed chatter pushes back on imminent rate hikes, we see the yield premium that US Treasury’s hold over German debt blowing out. For example, the yield premium to hold US2yr Treasuries over 2yr German bonds has pushed to 185bp (or 1.85%), having been at 154bp in mid-Jan. This is putting a bid into the USD, with the exchange rate pushing into the December pivot low of 1.0723 and breaking the recent channel lows. By way of momentum, we see that the 2-day ROC has moved sharply lower to -1.20 – consider that since Jan 2023 on the 14 occurrences where the 2-day ROC has pushed below -1, 80% of the occurrences have resulted in a mild short covering rally the following day. The trend, however, suggests this pair trades lower but I would look to initiate new shorts either on a close below 1.0723 or limits into 1.0775.
EURSEK – SEK most sensitive to a lift in interest rates
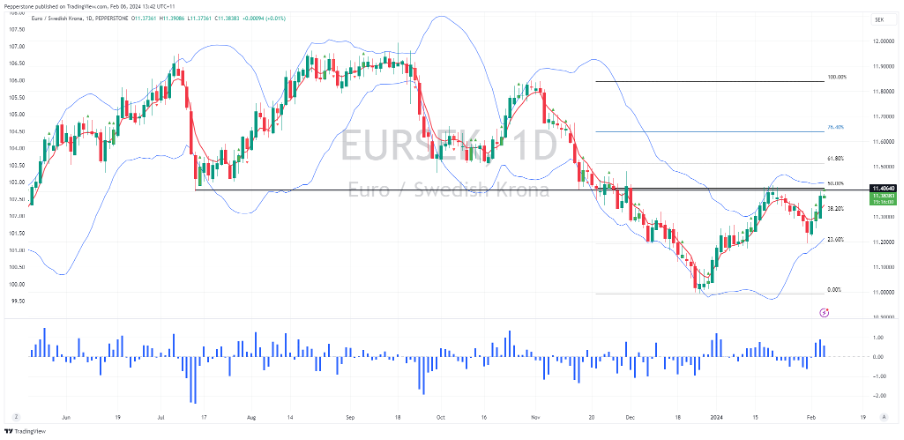
USDSEK has completed an inverse head and shoulders, and the probability is this pair moves higher over time. The SEK is one of the most sensitive to higher bond yields and the repricing of interest rates, so given the backdrop we’re seeing unfolding in global bond markets we could easily see a further underperformance in the SEK. Given the USD pairs are really all moving together (just with different betas), I am keen to look at the cross rates and look at opportunities ex-USD. EURSEK has a similar thematic but the impact of higher bond yields, and the prospect that the Riksbank will be more dovish than the ECB is seeing EURSEK push into the Jan highs and 50% retracement of the Oct-Jan sell-off. It feels like there could be good supply into 11.4244, but an upside closing break here would be a signal for new longs.
GBPUSD – a retest of 1.2600 looks likely
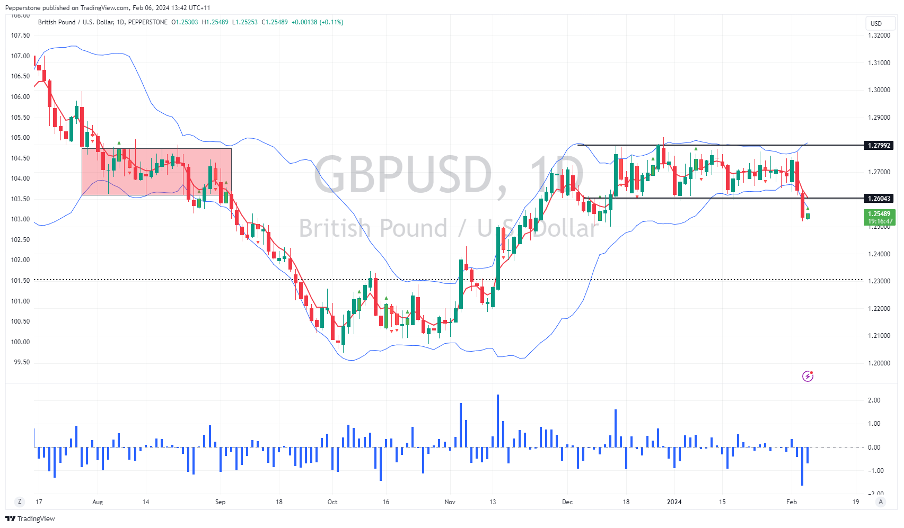
The downside break of the 1.2800 to 1.2600 range the pair has held since 14 Dec has been well traded by clients. Looking at the current skew in open interest, traders see a higher risk of a move back to the breakout point, with 71% of open positions currently held long. I see the risk of modest short covering through late Asia but would take the timeframe in and see how the price reacts into the former range lows and 5-day EMA. A rejection and increased signs of a trend day would suggest reengaging with shorts for a move towards the 100-day MA at 1.2469. Staying on the GBP theme, GBPCHF is also on the radar with a tactical view of potential upside - given the set-up on the higher timeframes its aggressive to be long the cross at levels, but if that is the case, I would be placing tight stops below 1.0880, with a view to add to the position on a close through 1.0960.
China CN50 index – putting in a base?
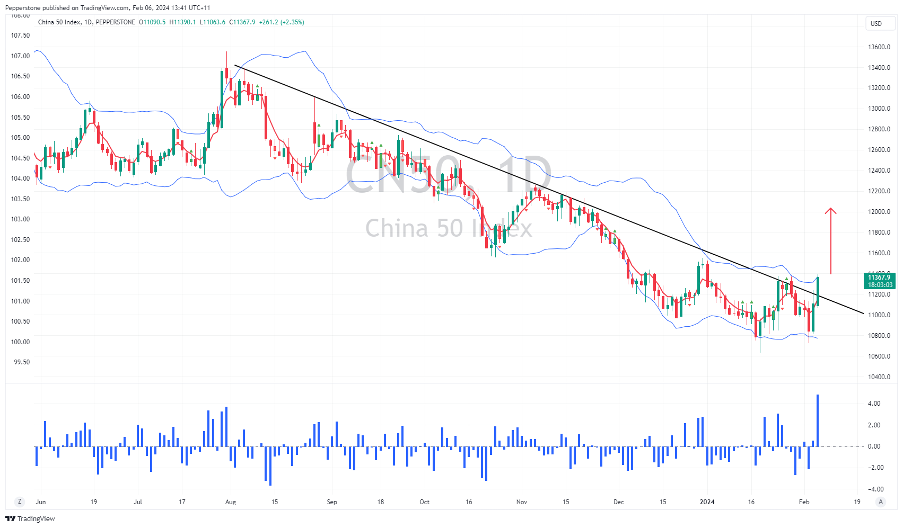
The CN50 represents the largest 50 mainland A-share companies but trade (as a futures product) on the Singapore futures exchange.
These are interesting and mysterious times in China’s capital markets, but one thing is clear, most want to be involved in picking the turn in these markets. While there are many equity indices to choose from - covering tech, large and small caps, as well as regionally specific, it’s the CN50 index which looks most likely to be putting in a base, with the potential to turn higher. Here, a push through the double bottom neckline at 11,378 could indicate a higher confidence that the lows have been seen and a further push to 12k could be on the cards. Conversely, a downside break of 10,800 could see the bear trend gain renewed legs.
Tactically I like long CN50 / short US2000 trade – the trade is working, and both legs are priced in USD.
XAUUSD – holding in well despite moves in rates and the USD
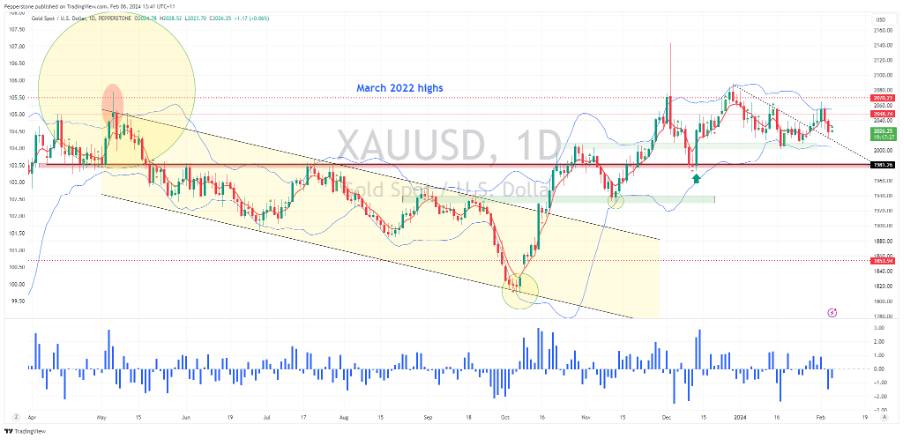
With US 10-year real rates pushing higher into 1.90% and rate cut expectations being priced out of the US interest rate and swap curve, and with the USD breaking out, gold longs should be enthused by the yellow metals inability to roll over and head into $2000. The ability to absorb several traditional negative catalysts suggests there are big counterweights in place, such as foreign central bank buying – but as we see on the daily gold is tracking a sideways range with volatility compression a core theme. The longer we see the volatility squeeze, the more powerful the potential trend could be. For now, playing a range of $2060 to $2005 seems the play.
Related articles
此处提供的材料并未按照旨在促进投资研究独立性的法律要求准备,因此被视为市场沟通之用途。虽然在传播投资研究之前不受任何禁止交易的限制,但我们不会在将其提供给我们的客户之前寻求利用任何优势。
Pepperstone 并不表示此处提供的材料是准确、最新或完整的,因此不应依赖于此。该信息,无论是否来自第三方,都不应被视为推荐;或买卖要约;或征求购买或出售任何证券、金融产品或工具的要约;或参与任何特定的交易策略。它没有考虑读者的财务状况或投资目标。我们建议此内容的任何读者寻求自己的建议。未经 Pepperstone 批准,不得复制或重新分发此信息。

