What does the VWRL ETF invest in?
The VWRL ETF stands for the FTSE all-world Exchange Traded Fund (*ETF). It is an investment fund that acquires securities with the intention of tracking the performance of the FTSE All-world Index.
*An ETF is an Exchange Traded Fund. They look to track the performance of a basket of assets, commodities or, in this case, an index. An ETF is traded like shares on a stock exchange. It is a pooled investment fund. Trading CFD ETFs through Pepperstone is a derivative of the underlying product.
The Objective
The VWRL fund seeks to provide long-term growth of capital by tracking the performance of the index, a market- capitalization weighted index of common stocks of large to mid-cap companies in developed and emerging countries.
Weighted investments
The top 5 holdings within the fund make up 11.83% of overall investments with over a 4% allocation in Apple Inc.
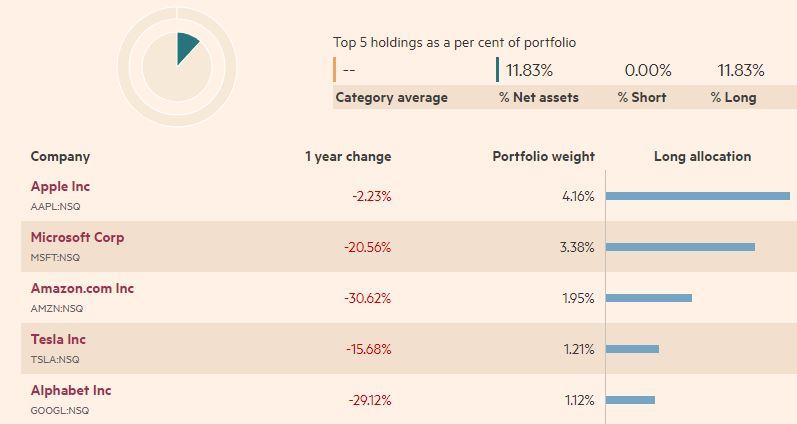
Figure 1 marekts.ft.com 10/10/2022
Invested Sectors
It is plain to see from the single stock allocation that the VWRL is weighted towards the technology sector.
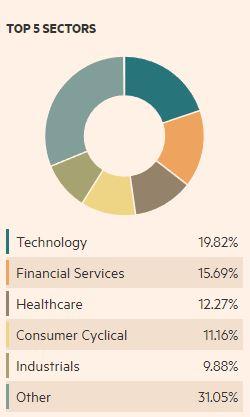
Figure 2 marekts.ft.com 10/10/2022
A look from a technical perspective
Historic price
Since its inception in May 2012, the VWRL ETF witnessed an increase of nearly 200% (from a 31.18 low to a 93.36 high).
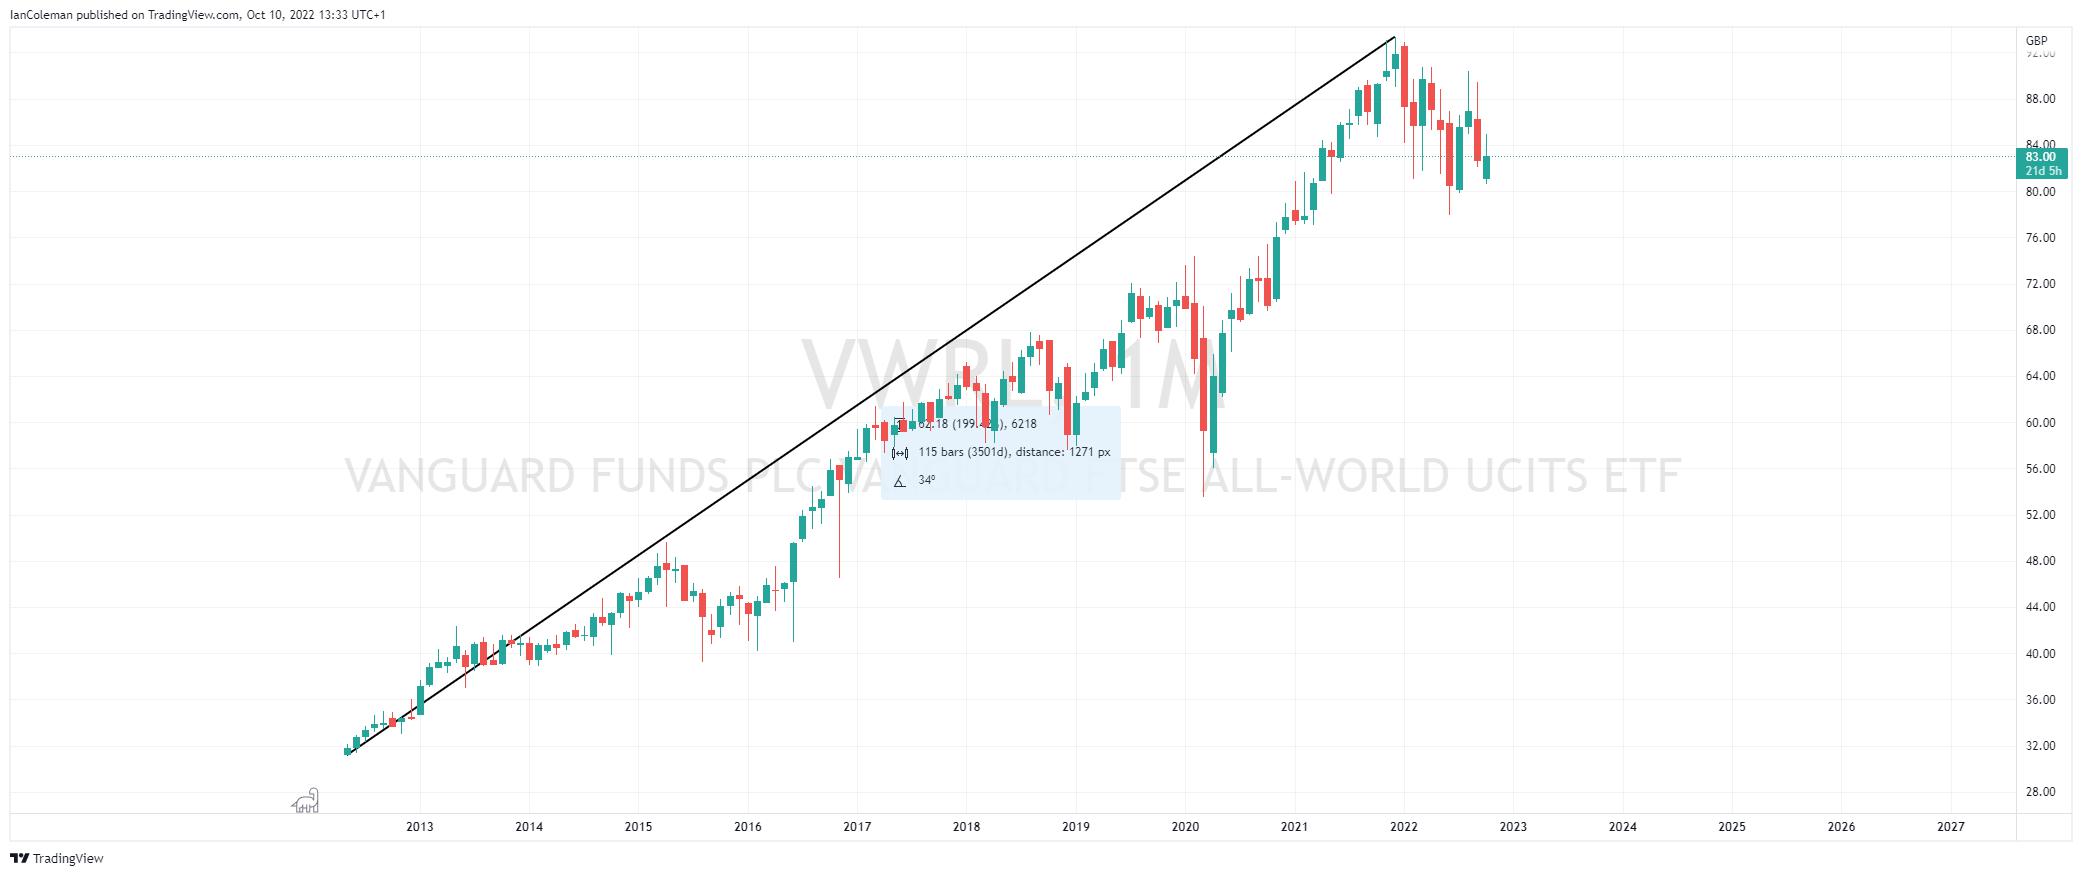
Figure 3 TradingView VWRL rally
Although we have seen a correction the downside, we are still holding within a bullish channel formation with trend line support located at 68.50.
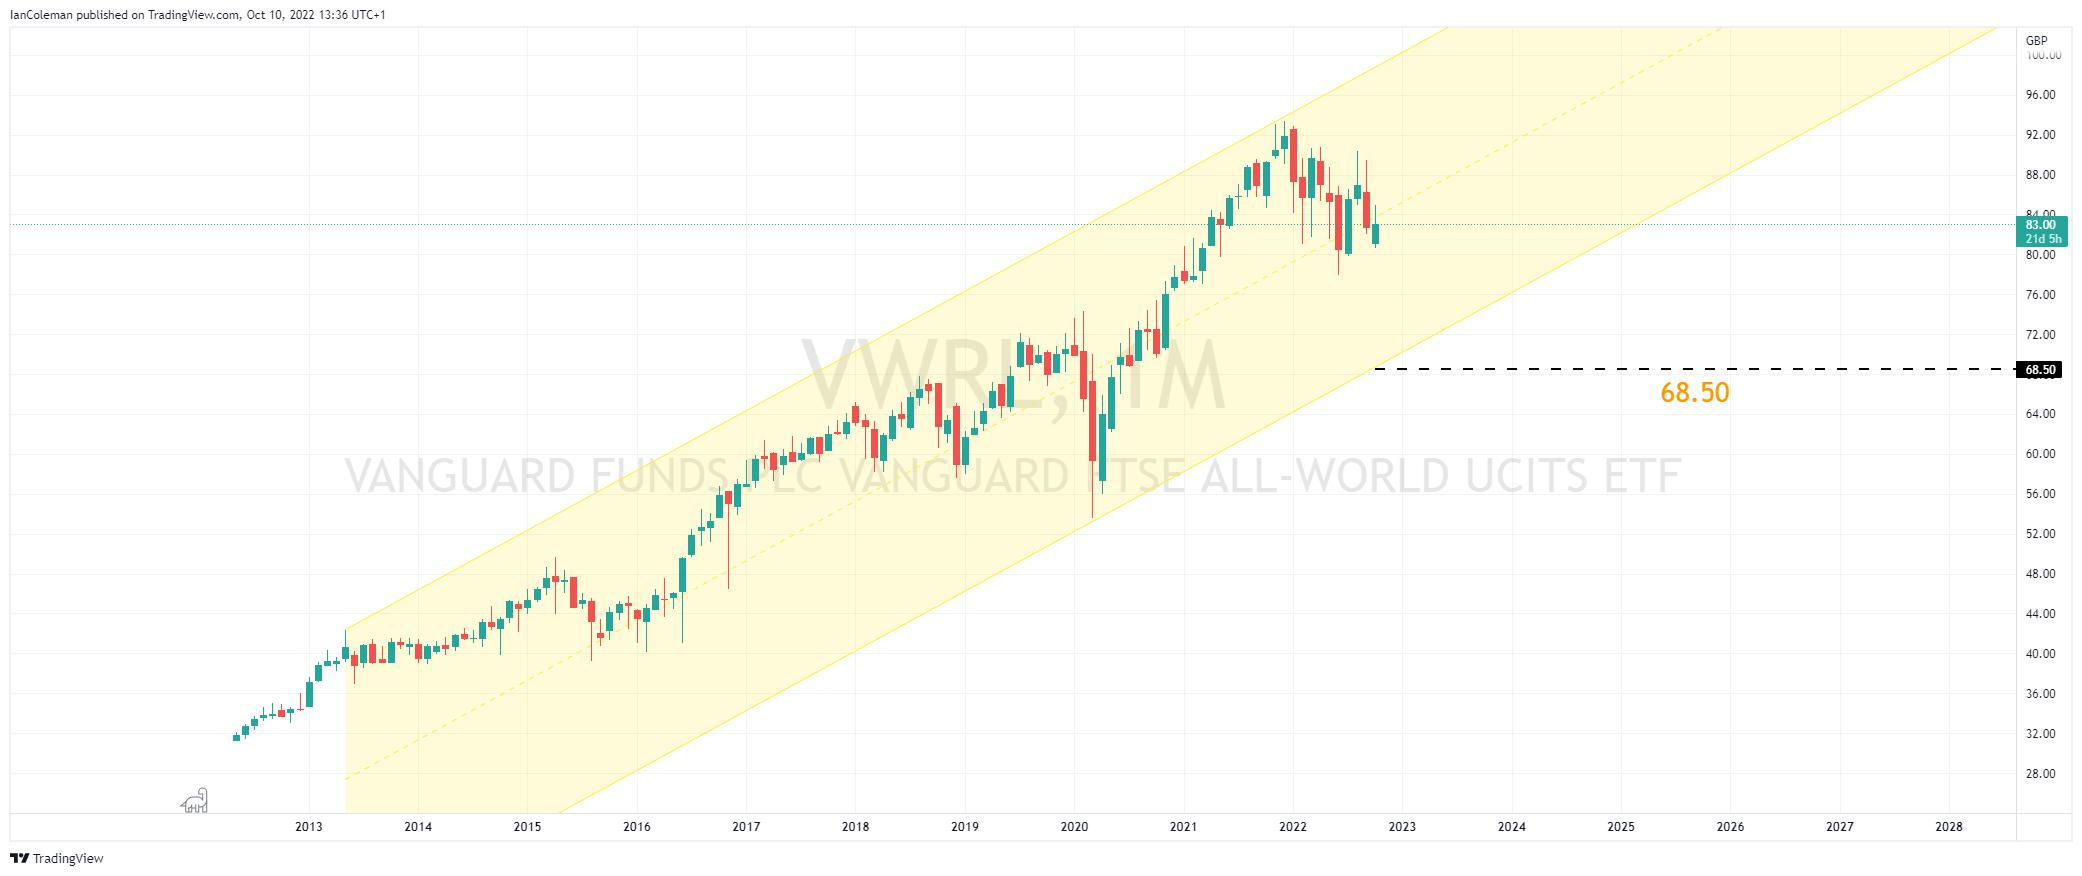
Figure 4 TradingView bullish channel
A look from a technical analysis perspective.
VWRL Weekly Chart
The weekly chart offers two possible bullish technical formations for the ETF:
- We look to be holding within an Expanding Wedge formation (dashed black lines). This pattern has an eventual bias to break to the upside.
- The last rally stalled close to the 78.6% Fibonacci level of 90.07 (from 93.36 to 77.90)
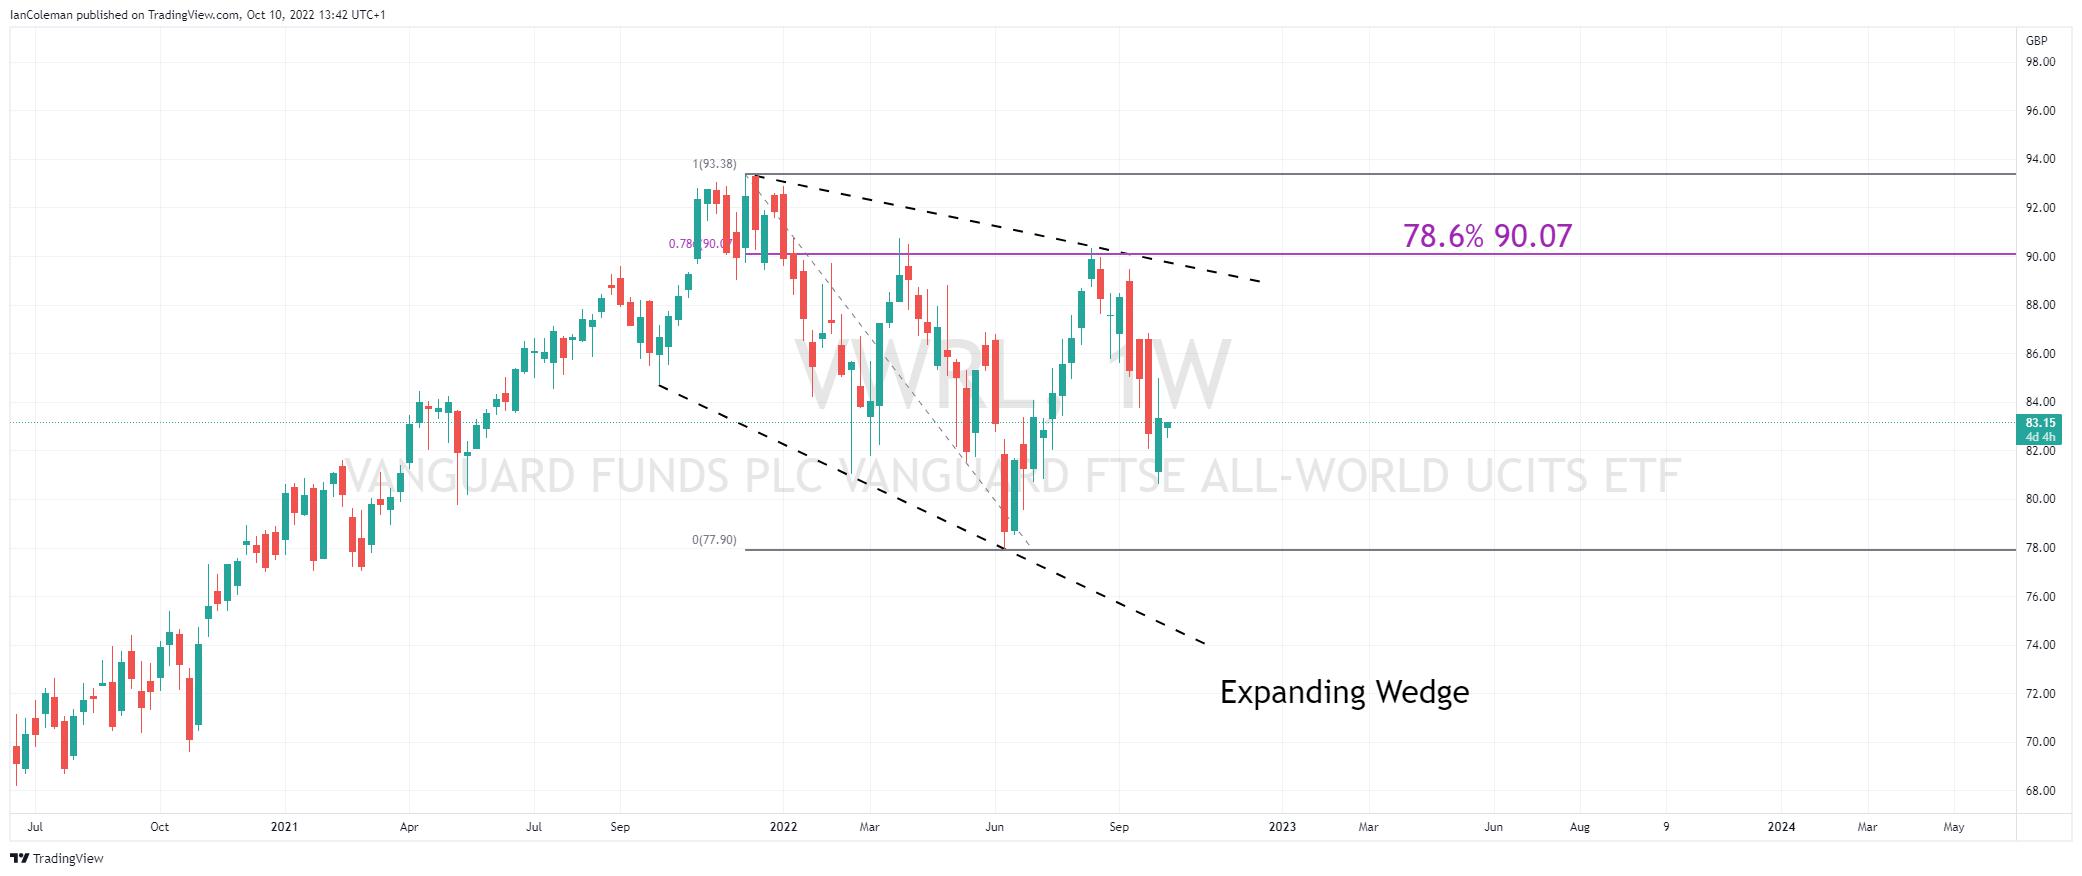
Figure 5 TradingView Expanding Wedge and 78.6%
If 77.90 holds (the swing low from the week 13th of June), we could see an extension to the upside to complete a Cypher pattern known as a bearish Butterfly formation.
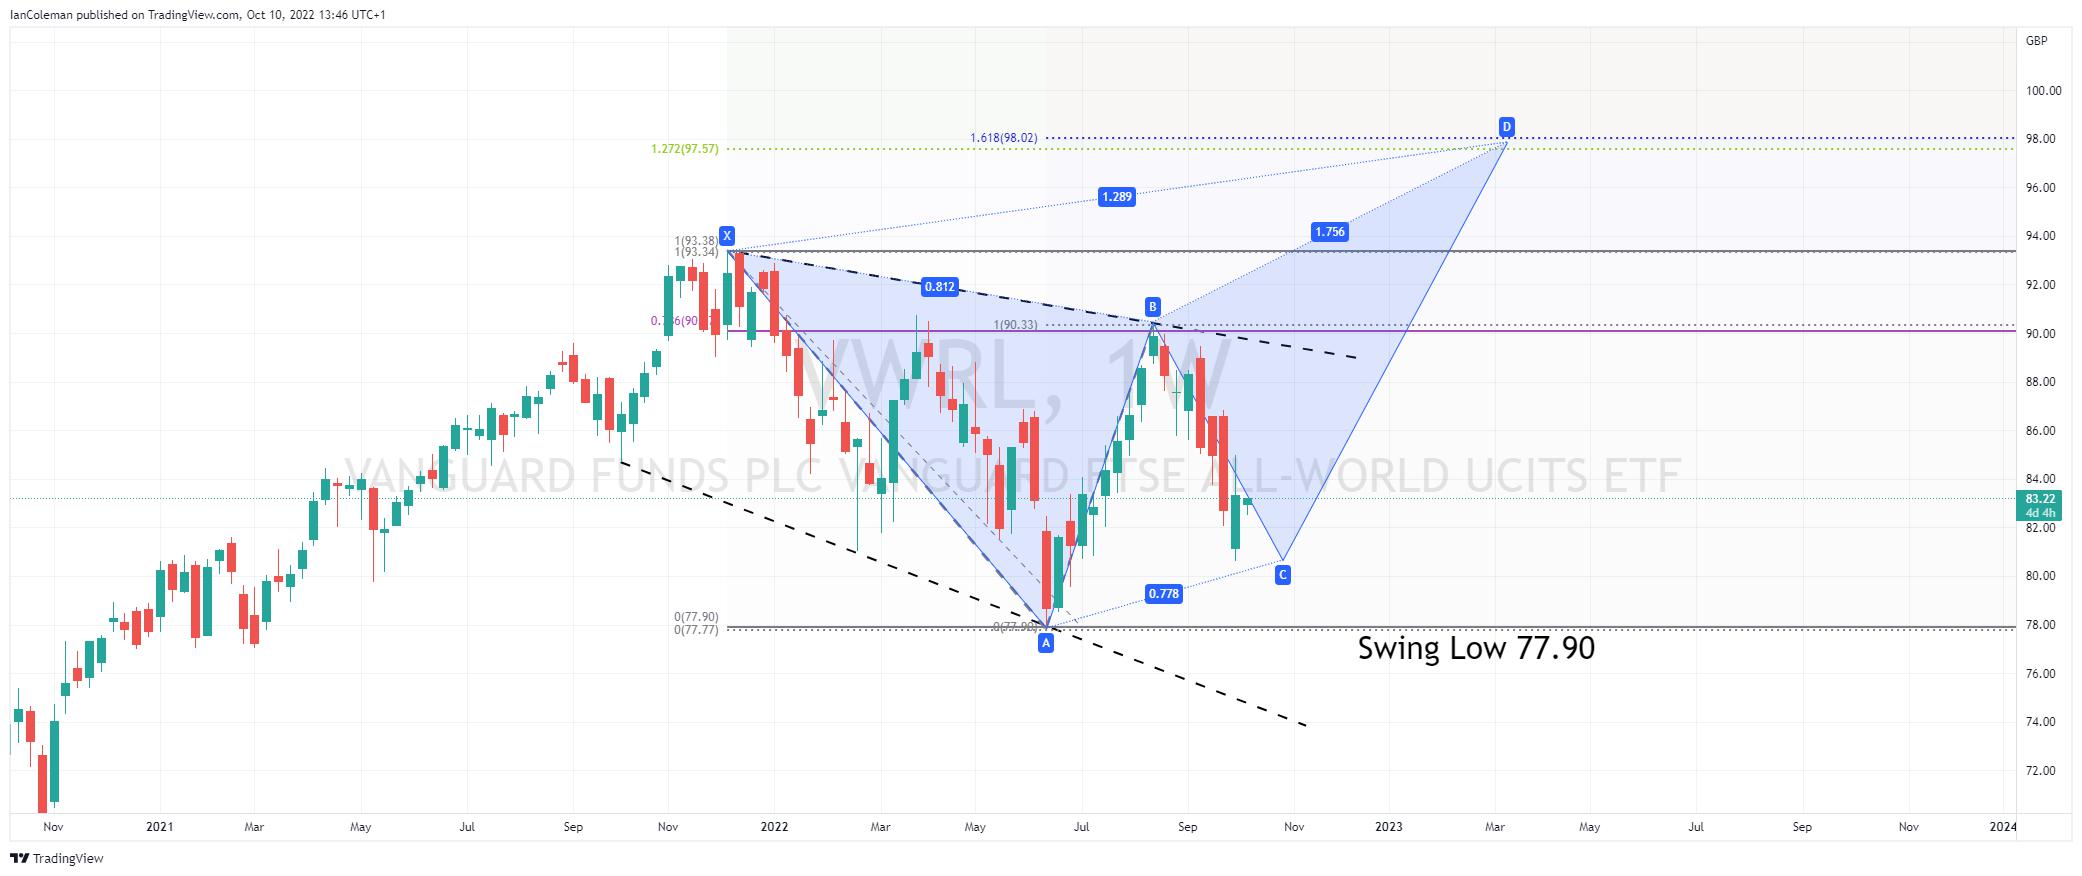
Figure 6 TradingView possible Butterfly pattern
To learn more about technical analysis, please click here.

此处提供的材料并未按照旨在促进投资研究独立性的法律要求准备,因此被视为市场沟通之用途。虽然在传播投资研究之前不受任何禁止交易的限制,但我们不会在将其提供给我们的客户之前寻求利用任何优势。
Pepperstone 并不表示此处提供的材料是准确、最新或完整的,因此不应依赖于此。该信息,无论是否来自第三方,都不应被视为推荐;或买卖要约;或征求购买或出售任何证券、金融产品或工具的要约;或参与任何特定的交易策略。它没有考虑读者的财务状况或投资目标。我们建议此内容的任何读者寻求自己的建议。未经 Pepperstone 批准,不得复制或重新分发此信息。