.jpg?height=93&quality=100)
OPEC+ surprised markets last week with its hawkish approach to rollover current supply cuts for all members bar Russia and Kazakhstan (130k bpd and 20k bpd respectively) during the month of April. Additionally, Saudi Arabia will withhold its 1 mln bpd production throughout April, before only gradually bringing it back online in May. Demand remains robust due to vaccinations, covid cases falling, mobility statistics rising and air travel ticket purchases seeing good demand. Could this firmer oil price bring shale producers back into the mix, denting OPEC+’s hard work? Geopolitically, oil never disappoints - on Sunday there was an attempted drone attack from the Houthi rebels on Saudi infrastructure. The infrastructure was left unscathed, however, the frequency of these attacks is causing oil markets to price in a risk premium. Most investment bank forecasts sit around $75-$80.
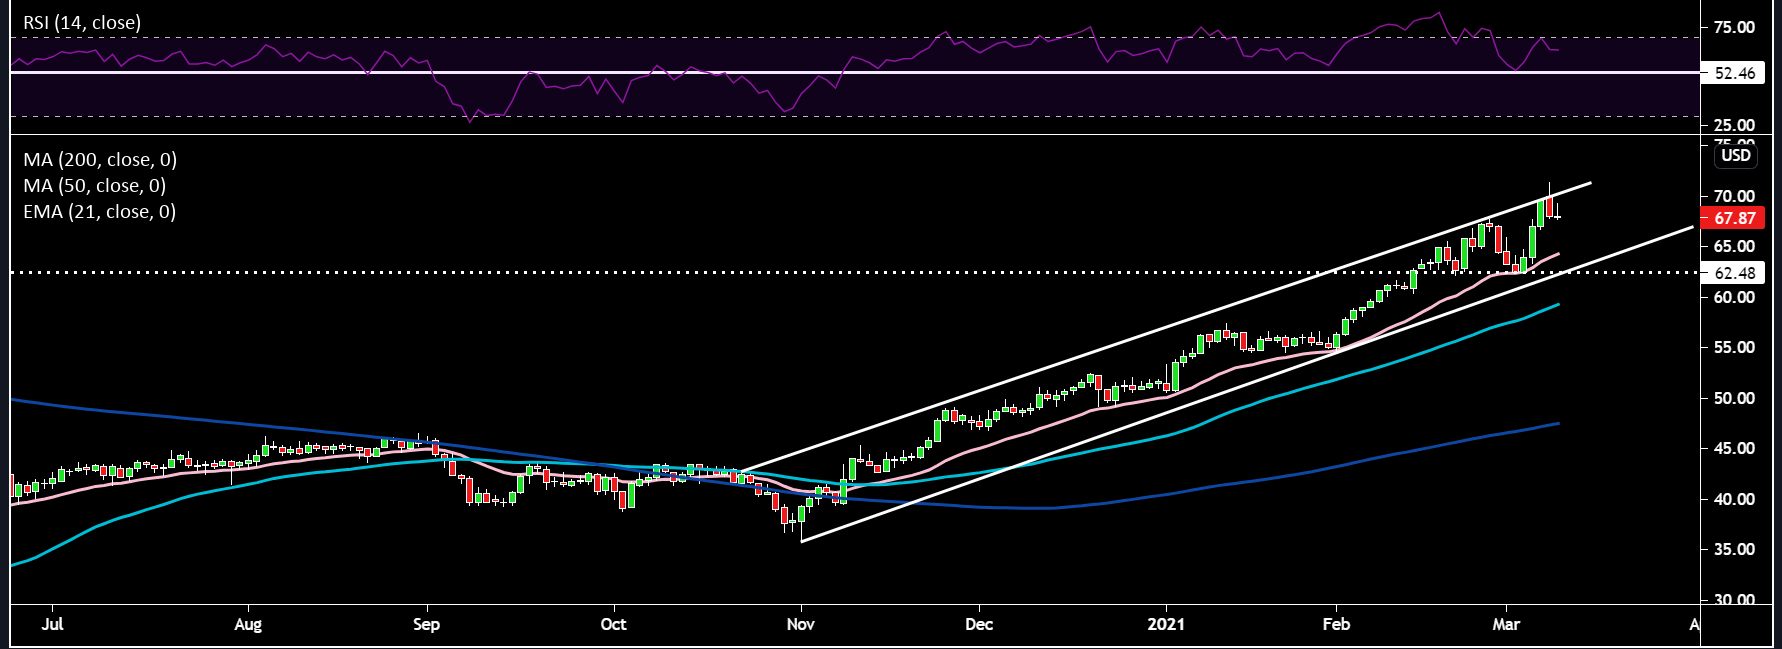
Pink line - 21-day EMA; Light Blue line - 50-day SMA; Dark Blue line - 200-day SMA (same for other charts)
Brent crude continues to form a beautiful ascending channel. With price now scratching right at the top of that channel. OPEC+'s meeting and the drone attack on Sunday was the catalyst for price to explode off the 21-day EMA and $62.50 support. The RSI also bounced off its 52.70 support, but is now close to overbought so fresh longs could be deployed on a pullback. We did see a pullback yesterday on some strong dollar strength which coincided with the top of the channel trend line too. Could price drift lower to the 21-day EMA around the 65 level, before its next leg higher?
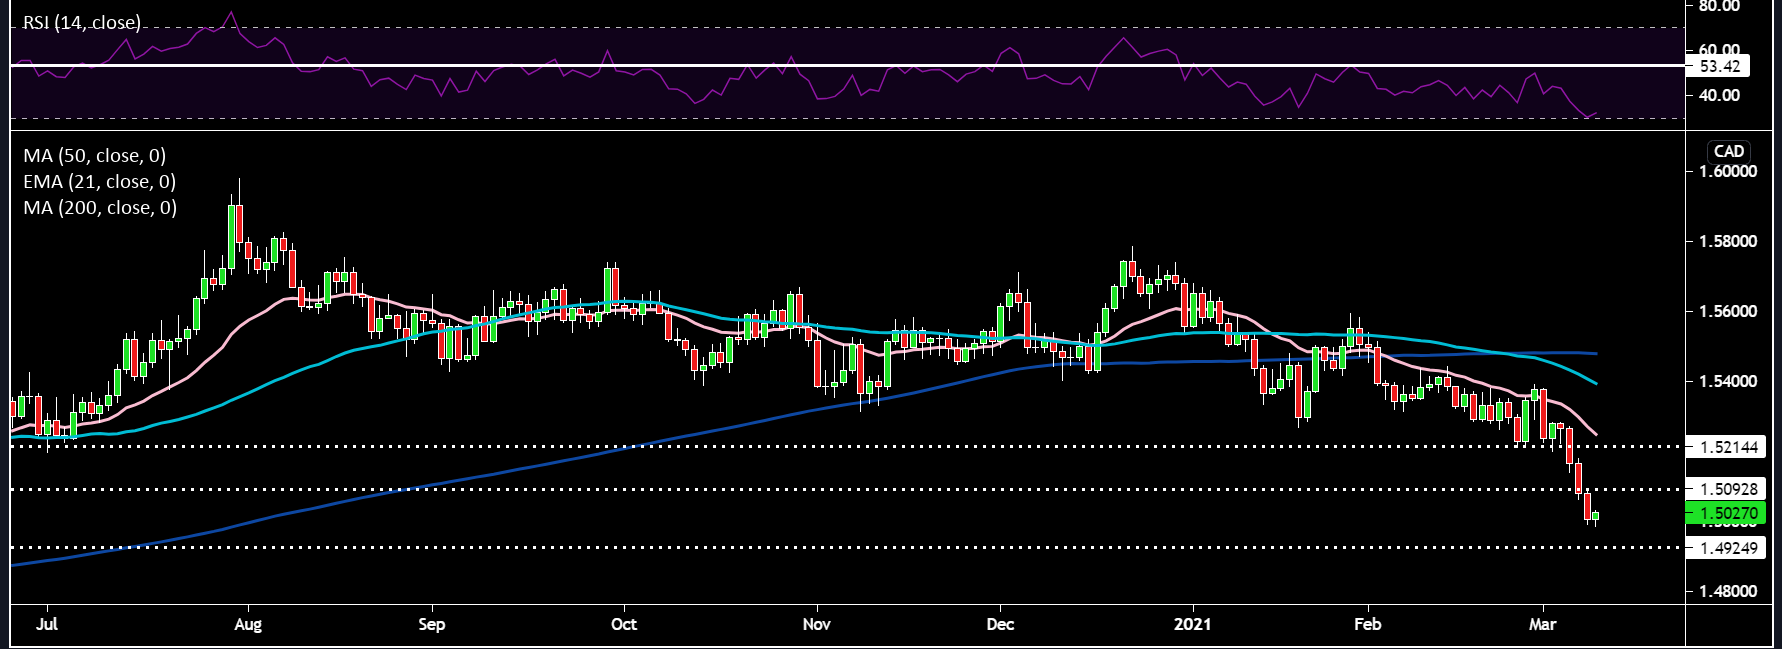
EURCAD has been incredibly weak and those that decided to short would have done well. There is more liquidity within the USDCAD cross, however, the weakness in the euro makes it a good pair to express CAD strength on firmer oil prices. It has fallen a lot, however, if oil heads higher into the mid-70s then this cross will head further south. RSI looks to be bouncing off oversold levels as well as a doji candle forming indicating that we may get a brief retracement upwards towards the 1.51 level and 1.52 level (around the 21-day EMA). This could be a good zone to watch for implementing shorts.
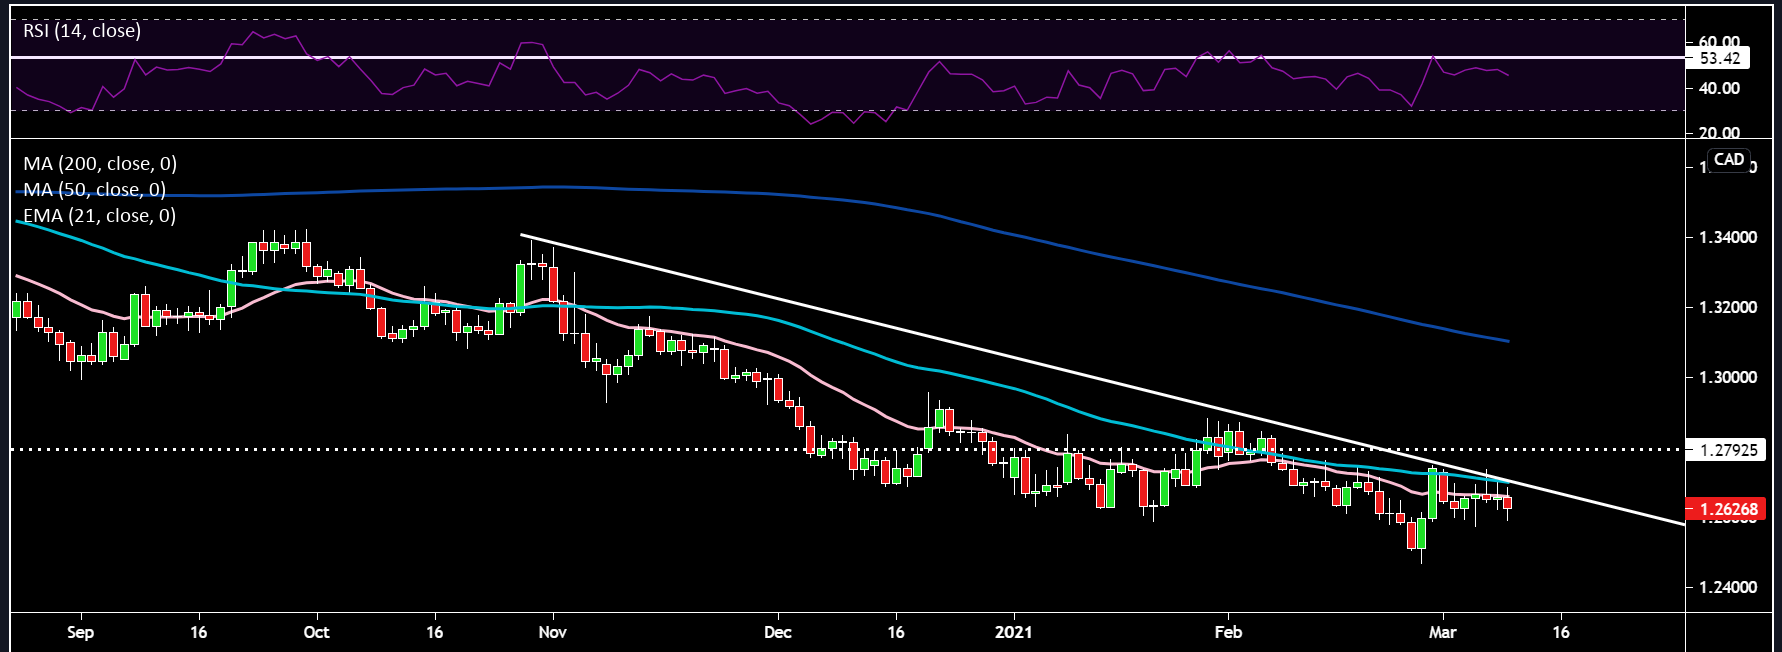
USDCAD or the Loonie has been grinding slowly lower since the March blow-off top. The downtrend from end of October 2020 has been tested multiple times, capping price gains. The 21-day EMA and 50-day SMA have also acted as a dynamic resistance. Despite recent dollar strength the surge in oil has prevented the pair from conclusively breaking above the 1.28 region. While the RSI remains below the 53.42 level, the bias remains to the short side. However, on a weaker oil price and stronger dollar we could breach the downtrend line and have a real run at the 1.28 region. On the downside the 1.25 area would be a good target.
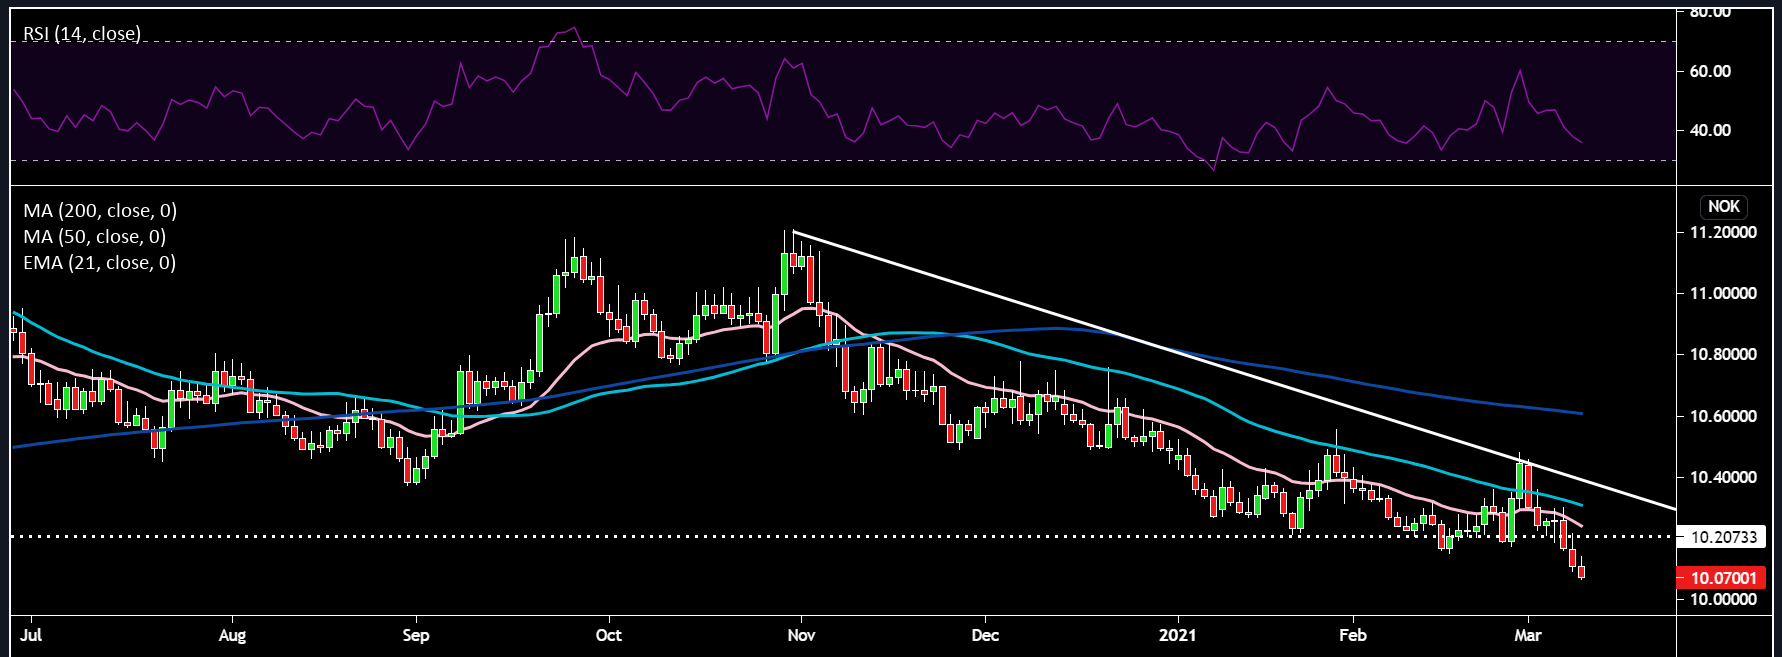
EURNOK has obeyed the 50-day SMA and 21-day EMA very well with a shorting every time price touches those averages working well. RSI is approaching oversold so we will need to monitor that. For any retracements upwards 10.20 remains a good spot to think about potentially adding shorts, it’s also close to the 21-day EMA and will have shaken out some weaker hands.
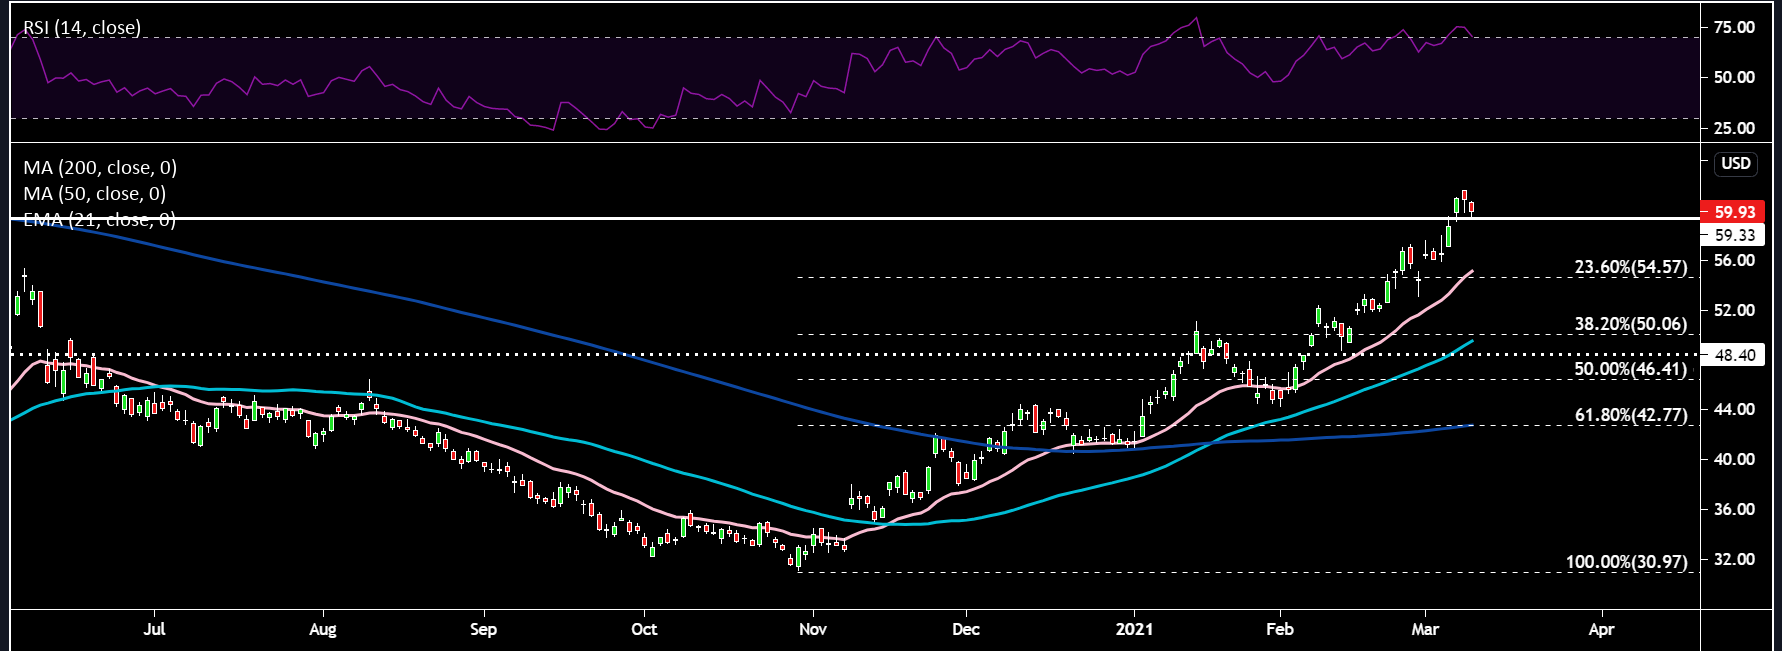
Another way to play the oil theme is through our US equity offering. ExxonMobil’s chart is looking interesting. It looks like the RSI has started to roll over out of overbought territory. So far though price seems to be holding the 59/60 support level. If one is bullish on oil over the short-medium term, then a correction in price perhaps down to the 55/54.5 level around the 23.6% Fibonacci level and the 21-day EMA may be a good zone to reload some longs.
Related articles

Bereit zu traden?
Es ist einfach, ein Pepperstone-Konto zu eröffnen. Stellen Sie Ihren Antrag innerhalb von Minuten, auch mit einer geringen Einzahlung. Beginnen Sie Ihre Reise mit Pepperstone noch heute.
Diese Information wurde von Pepperstone GmbH bereitgestellt. CFD sind komplexe Instrumente und beinhalten wegen der Hebelwirkung ein hohes Risiko, schnell Geld zu verlieren. 73,9 % der Kleinanlegerkonten verlieren Geld beim CFD-Handel mit diesem Anbieter. Sie sollten überlegen, ob Sie verstehen, wie CFD funktionieren und ob Sie es sich leisten können, das hohe Risiko einzugehen, Ihr Geld zu verlieren. Diese Inhalte stellen keine unabhängige Finanzanalyse dar, sondern gehören zu unserer Werbemitteilung. Folglich sind die gesetzlichen und regulatorischen Bestimmungen, die sich auf unabhängige Finanzanalysen beziehen, nicht auf diese Website und unsere Kommunikation anwendbar. Diese Inhalte (unabhängig davon, ob sie Meinungen wiedergeben oder nicht) dienen nur der allgemeinen Information und berücksichtigen Ihre persönlichen Umstände oder Ziele nicht. Obwohl die in dieser Werbemitteilung enthaltenen Informationen aus Quellen, welche als verlässlich betrachtet werden können, bezogen wurden, gewährleisten weder Pepperstone noch der Autor die Richtigkeit oder Vollständigkeit dieser Informationen. Alle Informationen sind nur indikativ, können ohne vorherige Mitteilung abgeändert werden und können jederzeit veraltet sein. Weder Pepperstone noch der Autor übernehmen Haftung für Verluste. Informationen über die frühere Wertentwicklung eines Finanzinstruments lassen keine verlässliche Schlussfolgerung auf die zukünftige Entwicklung zu. Die Rendite kann infolge von Währungsschwankungen steigen oder fallen kann.