Les CFD sont des instruments complexes et présentent un risque élevé de perte rapide en capital en raison de l’effet de levier. 72.2% des comptes d’investisseurs particuliers perdent de l’argent lorsqu’ils investissent sur les CFD. Vous devez vous assurer que vous comprenez le fonctionnement des CFD et que vous pouvez vous permettre de prendre le risque élevé de perdre votre argent.
- Français
- English
- Español
- Italiano
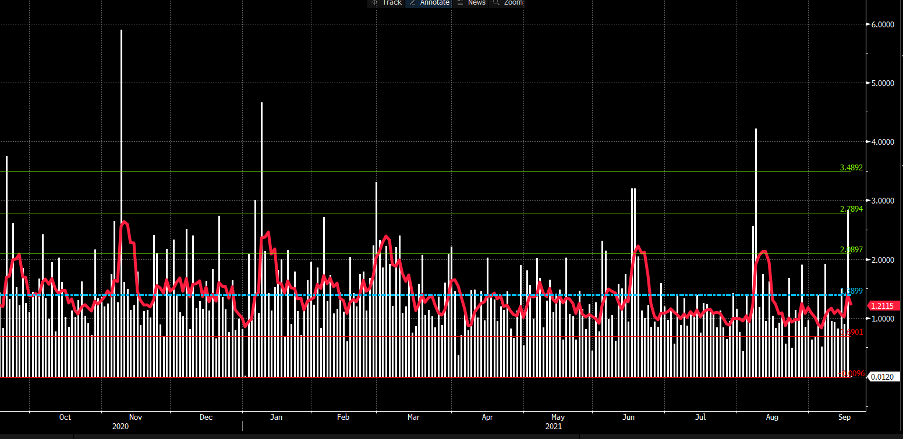
A 2.8% high-low range - a 2 standard deviation move using a 1-year sample – is one way we can understand the extent of movement, while in the options world 1-week implied volatility has picked up sharply and is trading 2.4 vols above 1-week realised vol.
Gold daily range – high-low/prior day close

(Source: Tradingview - Past performance is not indicative of future performance)
244k contracts traded in front-month gold futures is punchy but it's not outrageous, while our own flow has been well above average, which won’t shock – clients are now fairly net long, with 78% of all open positions held long – of course, this is not investment flow, and is trading capital that aggregates all different styles and timeframes, where the average duration of hold periods is ultra-short-term.
Whether I looked at the recent subdued implied volatility, or just through the price action in XAUUSD, everything was screaming out that range trading was still the play – clearly this view has been challenged – this thesis was also backed by the fact both nominal and real Treasuries have held tight a range since early August. Where until the debt ceiling is solved, which may take some time, then US bond yields wouldn’t be able to sustain a steep march higher, typically a gold negative.
USD strength has also kicked in, which has weighed on XAUUSD, and we’ve seen the USD work well against all G10 currencies, notably the higher beta plays like the ZAR and AUD. There has been some selling in US Treasuries, but 10yr real (inflation-adjusted) rates/TIPS are only up 3bp at -1.02%.
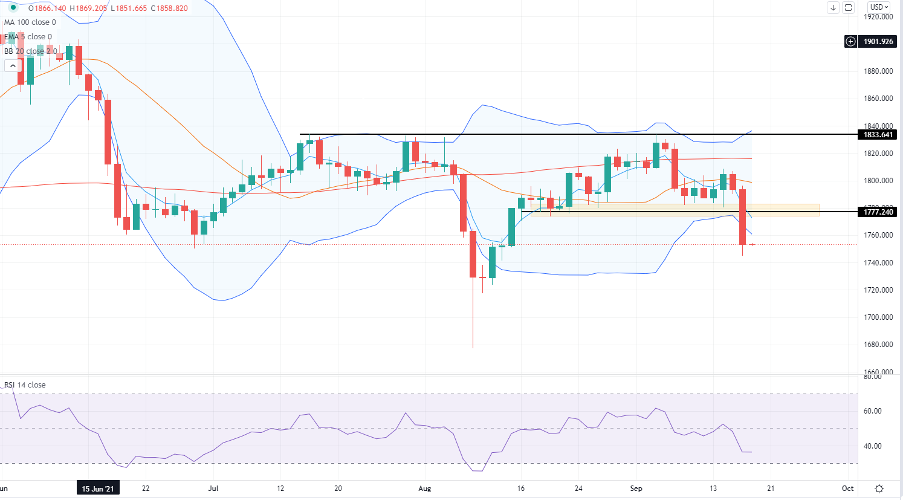
Gold daily chart

(Source: Tradingview - Past performance is not indicative of future performance)
My own view here is that while we may have seen some technical selling on the break of $1776 –predominantly this was a flow driven move, as it was far over the usual correlations we see with the USD and real rates and it screams of a fund(s) dumping gold exposure – the fact one fund manager at Blackrock (Russ Koesterich) disclosed on Bloomberg TV that he had reduced a significant position in gold to almost zero, tells me many of the big players are seeing reduced utility in gold as a hedge against the global central bank experiment, and gold is front running a rise in real rates.
A 3bp move higher in real Treasuries, meaning inflation-adjusted returns becomes less negative, may be small fry, but when funds and money managers feel we could be moving from -100bp to -50bp in US 10yr real Treasuries, it does make one consider their diversification plays. This view may still be premature ahead of the debt ceiling, which could become a market mover into November, and has the premise to keep bond yields suppressed – but I guess someone in the market is seeing a positive resolution which will ultimately lead to an increased supply of Treasuries and improved economics in Q4, married with the tapering of QE.
We also might be seeing funds positioning ahead of next week’s FOMC meeting – we’ll cover this in more depth on Monday, but on one hand, the view is we will get 'advanced notice' that tapering is coming, perhaps in November or December. On the other, we will get a new set of fed funds projections (‘dot plot’), and the possibility that the median estimate shifts the degree of hikes in 2023 from two hikes, to possibly three. Things get interesting in the 2024 estimate, and if the estimate for 2023 lifts to 0.875%, then one could easily see an estimate at 1.63% in 2024 – portraying an additional three hikes in 2024.
The move in gold is short-term oversold, but does this offer a signal for trading longs or will rallies be short live, where strength offers entry points for shorts in the hope of a bear trending market into the FOMC?
Related articles
Ready to trade?
It's quick and easy to get started. Apply in minutes with our online application process.
