
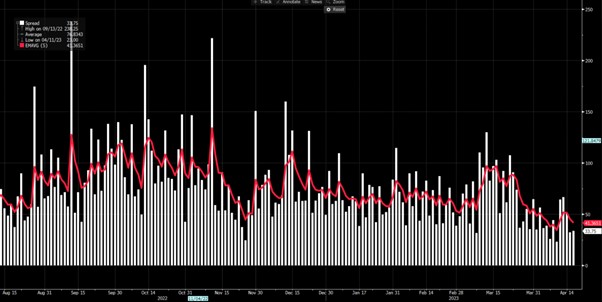
It’s not just the fact we haven’t seen the S&P500 close 1% lower since 22 March (18 sessions), but we also see the 5-day (exponential) moving average of the high-low trading range for S&P500 futures at a meagre 41-points. This is not far off the lowest levels since 2011, so traders are getting less and to work with intraday.
(Daily high-low trading range – S&P500 futures)
There isn’t one reason for the lower vol, so I have put some views on the considerations I see as causing these calmer conditions. I am sure there are others, but these jump out.
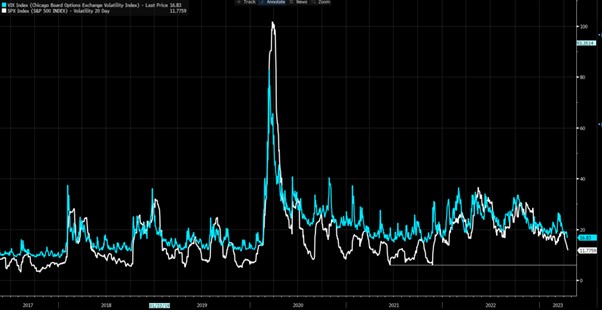
1.S&P500 realised volatility is impacting the VIX index – we see that S&P500 10-day realised vol is now 8.2%, with S&P500 20-day realised vol at 11.7%% - both are the lowest levels since Nov 21 – options market makers will typically look at how volatility is realising as the basis for pricing implied volatility. The fact the S&P500 just refuses to fall has also limited the demand for downside hedges- hedges cost money.
SPX 20-day realised volatility (white) vs the VIX index (blue)

2. CTAs (trend-following funds) have been getting progressively longer and their estimated net exposure is ‘max long’ US S&P500 futures. Volatility-targeting hedge funds are adding equity exposure as equity realised vol falls – lower vol begets lower vol.
3. Why sell your equity longs? Funds are taking advantage of the grinding price action in stocks and selling S&P500 index calls and using the premium to buy OTM (out of the money) S&P puts – this means they can essentially hold their core equity holdings and utilise optionality with a cheap/free hedge.
4. Reduced interest rate risk – the Fed are now fully data dependent and the market prices a 25bp hike in May, with an extended pause through to November – with a far more normal distribution in the skew of expectations for bond price/yields (i.e. yields could go either way and not just higher), we’ve seen bond vol (we use the MOVE index) fall from the highs on 15 March. Probable lengthy inaction from the Fed has lowered volatility.
5. A weaker USD has helped lower broad market volatility - The USD index (DXY) fell 4.8% from 8 March to 14 April – in that time the VIX index fell 9 vols from 26% to 17%
6. The Fed’s response to managing instability risk through the rollout of emergency credit facilities was truly meaningful – the market is becoming comfortable that there will be consolidation in the US banking sector ahead of us, but the Fed has cut the systemic event risk.
7. Increased liquidity - Reserve balances held with the Fed are +12% since March. We also see that since January the TGA (Treasury General Account) has been drawn down by $450B to sit at $109B.
8. Corporate share buybacks authorisation hit a new record and nears $400b – companies are the biggest buyers of stocks, and this is suppressing vol.
9. BoJ gov Ueda said on 10 April that YCC is still the best policy for the current economy – the has reduced JGB and JPY implied vol, which again has spilt over into G10 FX volatility.
10. The Fed funds rate was hiked aggressively from 0.25% to 5% - Yet while the US real policy rate (fed funds adjusted for headline CPI) has moved from -8% to -0.2%, it is still negative and to some that are not restrictive enough.
11. The rise of 0DTE (days to expiry) options – fewer traders are trading 20–40-day expiries and the volume in ultra-short-term options means we see less volume in the strikes that feed the VIX calculation.
Related articles


此处提供的材料并未按照旨在促进投资研究独立性的法律要求准备,因此被视为市场沟通之用途。虽然在传播投资研究之前不受任何禁止交易的限制,但我们不会在将其提供给我们的客户之前寻求利用任何优势。
Pepperstone 并不表示此处提供的材料是准确、最新或完整的,因此不应依赖于此。该信息,无论是否来自第三方,都不应被视为推荐;或买卖要约;或征求购买或出售任何证券、金融产品或工具的要约;或参与任何特定的交易策略。它没有考虑读者的财务状况或投资目标。我们建议此内容的任何读者寻求自己的建议。未经 Pepperstone 批准,不得复制或重新分发此信息。