What is stochastics and how can I use it in my forex trading strategy
Stochastics is a technical indicator, often referred to as an oscillator. It is placed on the chart and offers theoretical buying and selling opportunities based on the momentum of the underlying asset. It is often used in conjunction with other indicators such as the Relative Strength Index (R.S.I.). Using stochastics in your Forex trading strategy can offer a productive layer of confirmation.
The basic settings of stochastics
The stochastic indicator is produced from a complex formula. In basic terms, it works using the closing price of the product in relation to the high-low range of the price over a set number of past periods. The typical setting is a 14 period.
It produces two lines. The %K line is often referred to as the fast stochastic. The %D line is often referred to as the slow stochastic and is a 3-period moving average of %K.
Like the Relative Strength Index (R.S.I), it works around a range of 0 to 100. The asset is considered overbought above the 80 level and oversold below 20 but that’s only one way of looking at it and serves as another layer of confirmation.
Producing Buy and Sell Signals
The stochastic indicator produces a potential sell signal when the oscillator has moved into overbought territory (above 80) and the slow %D line moves below the faster %K line.
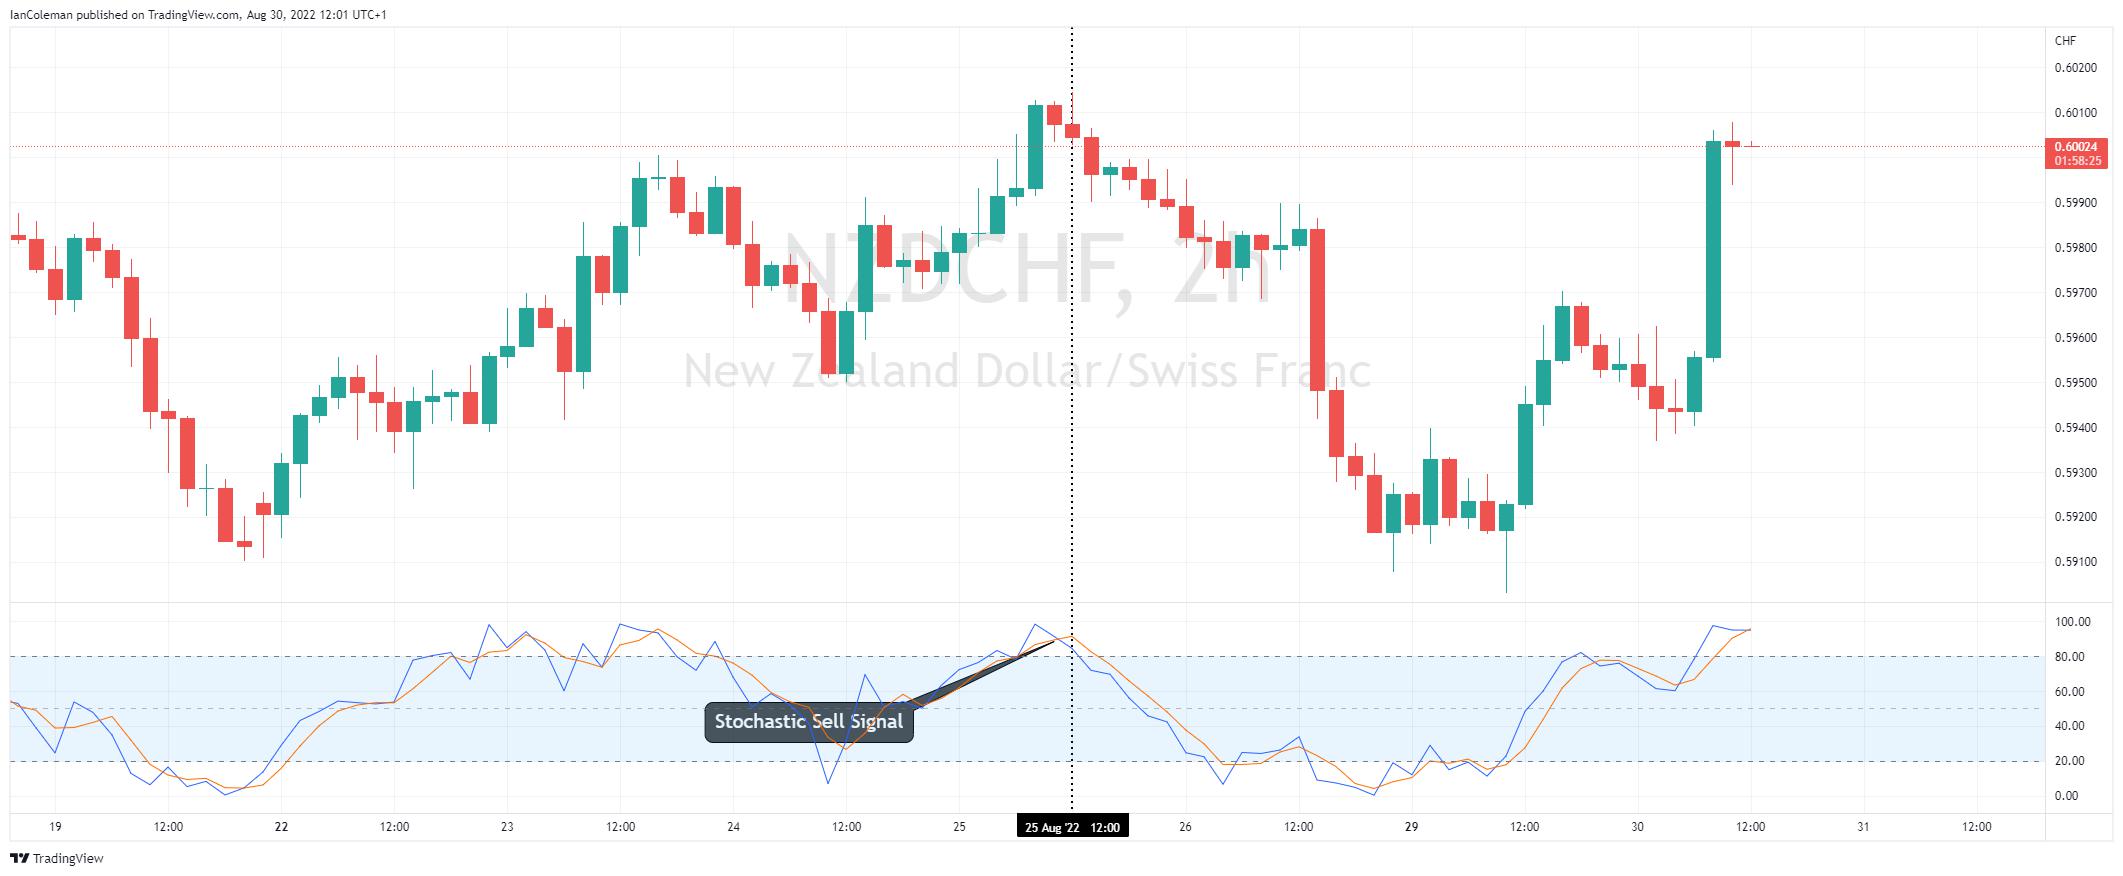
Figure 1 Trading View Stochastic Sell Signal
It produces a potential buy signal when the oscillator has moved into oversold territory (below 20) and the slow %D line moves above the faster %K line.
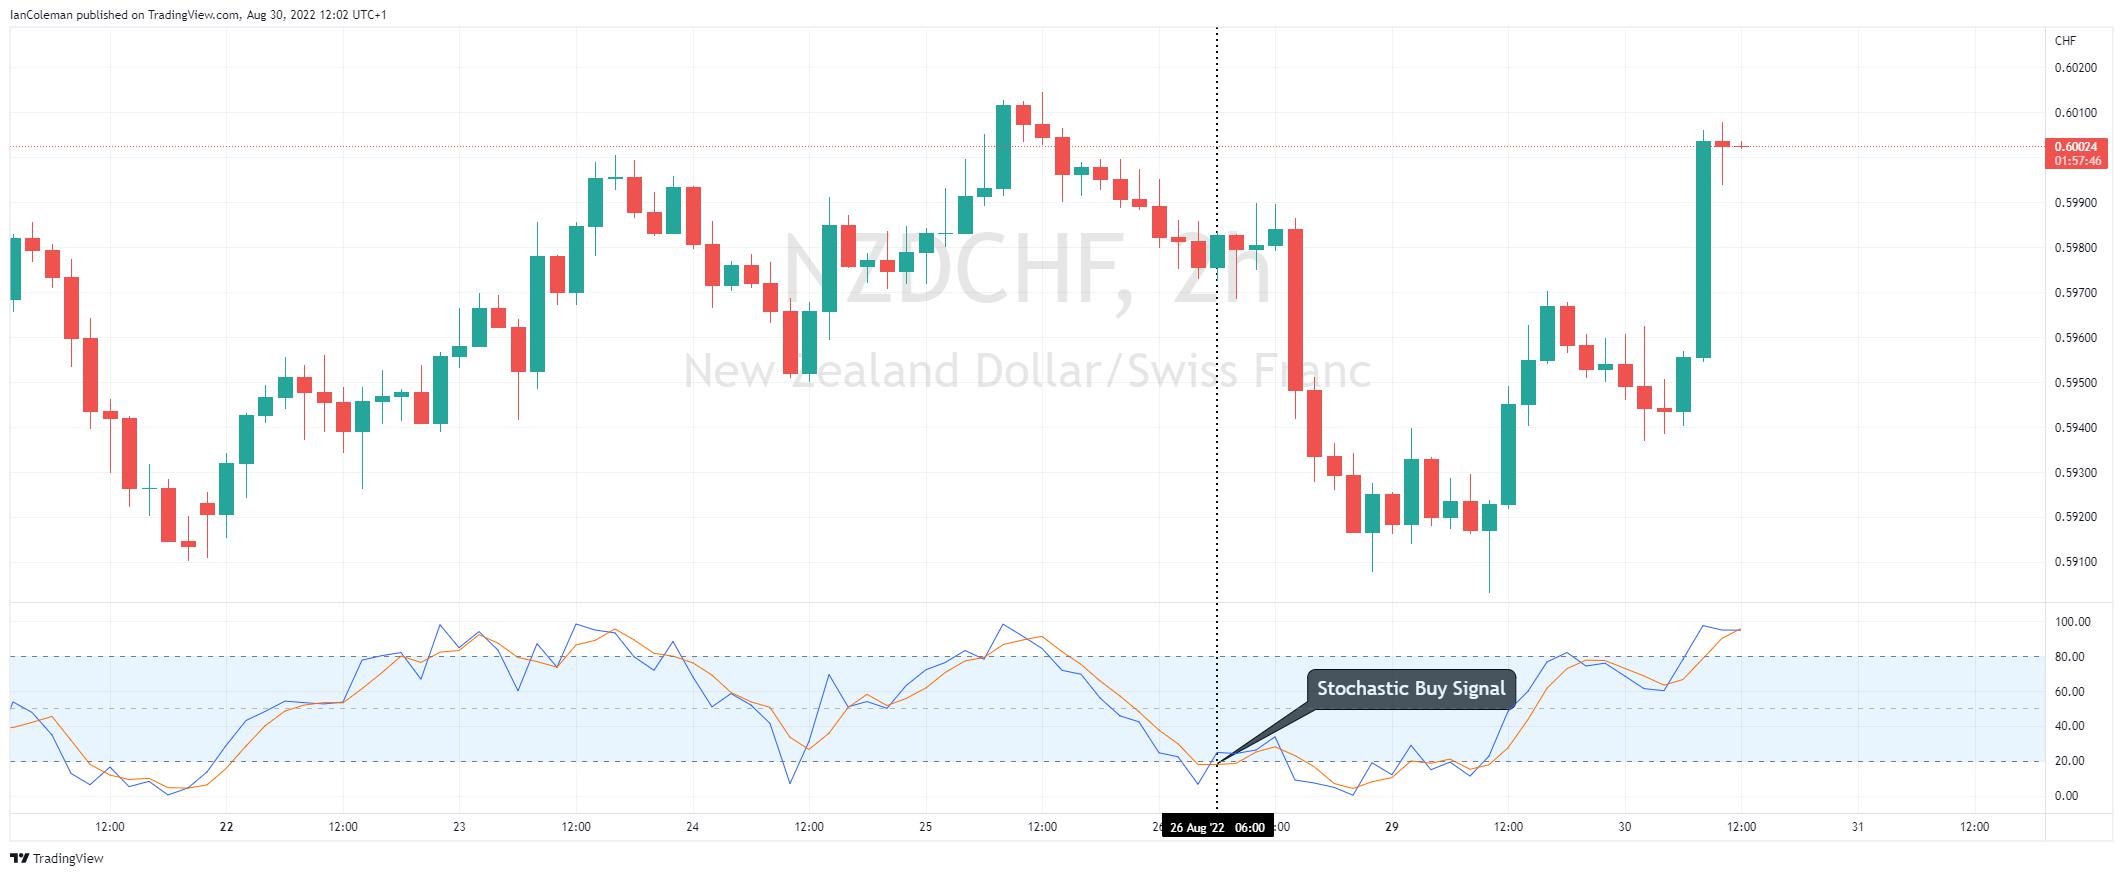
Figure 2 Trading View Stochastic Buy Signal
Dealing with false Signals
As you can clearly see from the chart above, the stochastic indicator can produce false signals. For this reason, it is not recommended as a stand-alone product and should only be used as extra confirmation. Price needs to be studied and analyzed before placing emphasis on indicators.
The power of divergence
The oscillator can also be used to produce bullish or bearish divergence. This highlights that the momentum or strength of the last rally (or selloff) is weakening. Divergence is often seen at the top or the bottom of a trend or can indicate at least a correction in the opposite direction.
Bullish divergence highlights the asset making a lower low while the stochastic indicator makes a higher low.
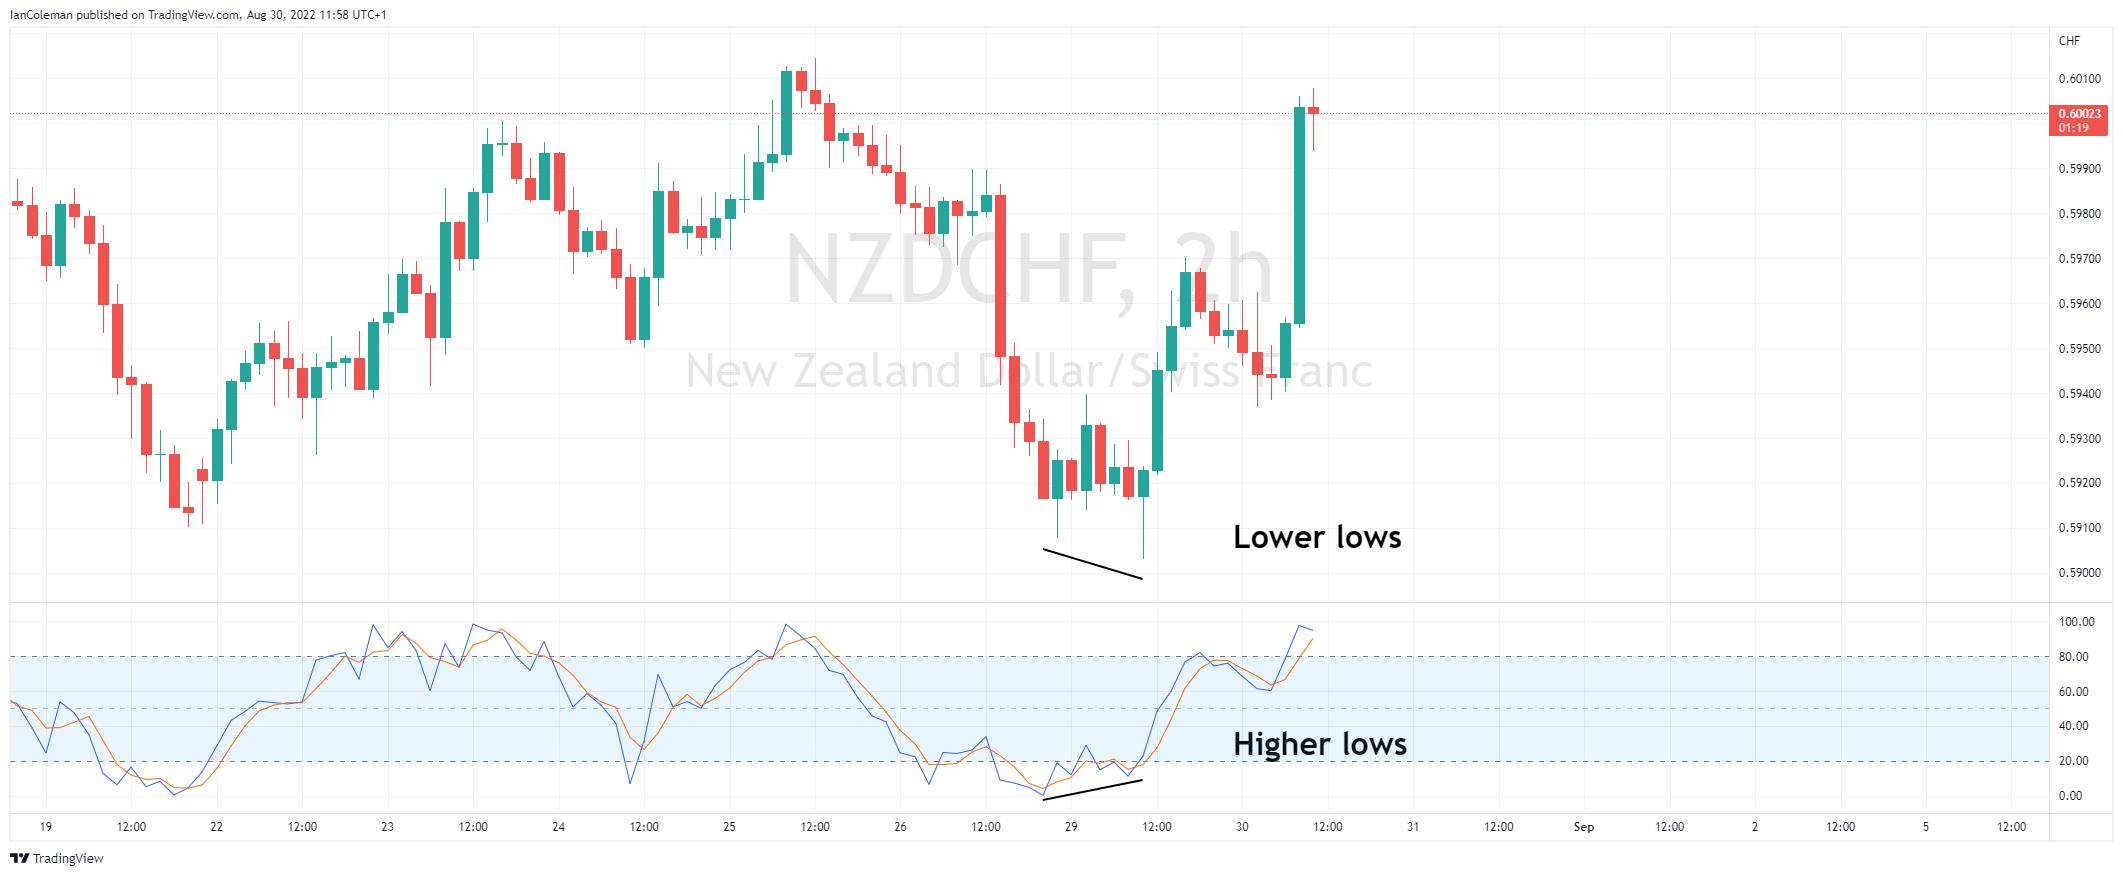
Figure 3 Trading View Bullish Divergence
Bearish divergence highlights the asset making a higher high while the stochastic indicator makes a lower high.
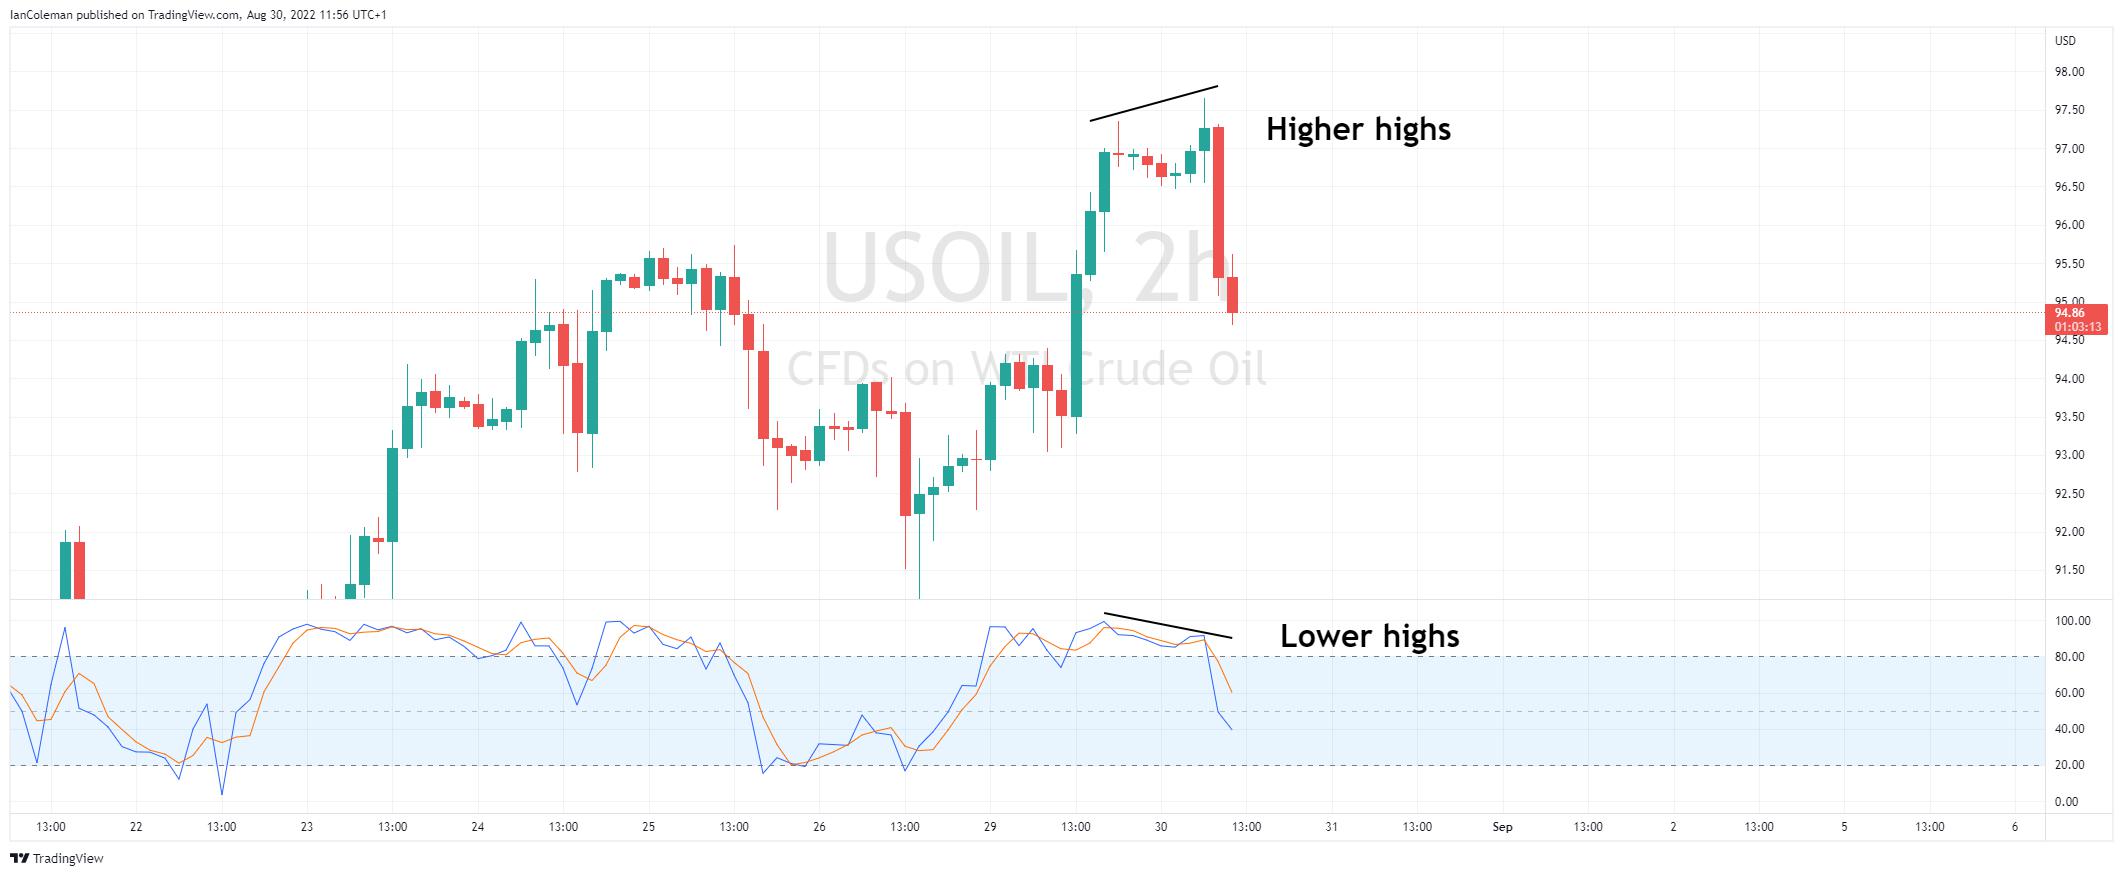
Figure 4 Trading View Bearish Divergence
The power of confirmation
Conclusion: Used in conjunction with other charting methods such as reversal candle formations and divergence, can strengthen the stochastics capabilities.
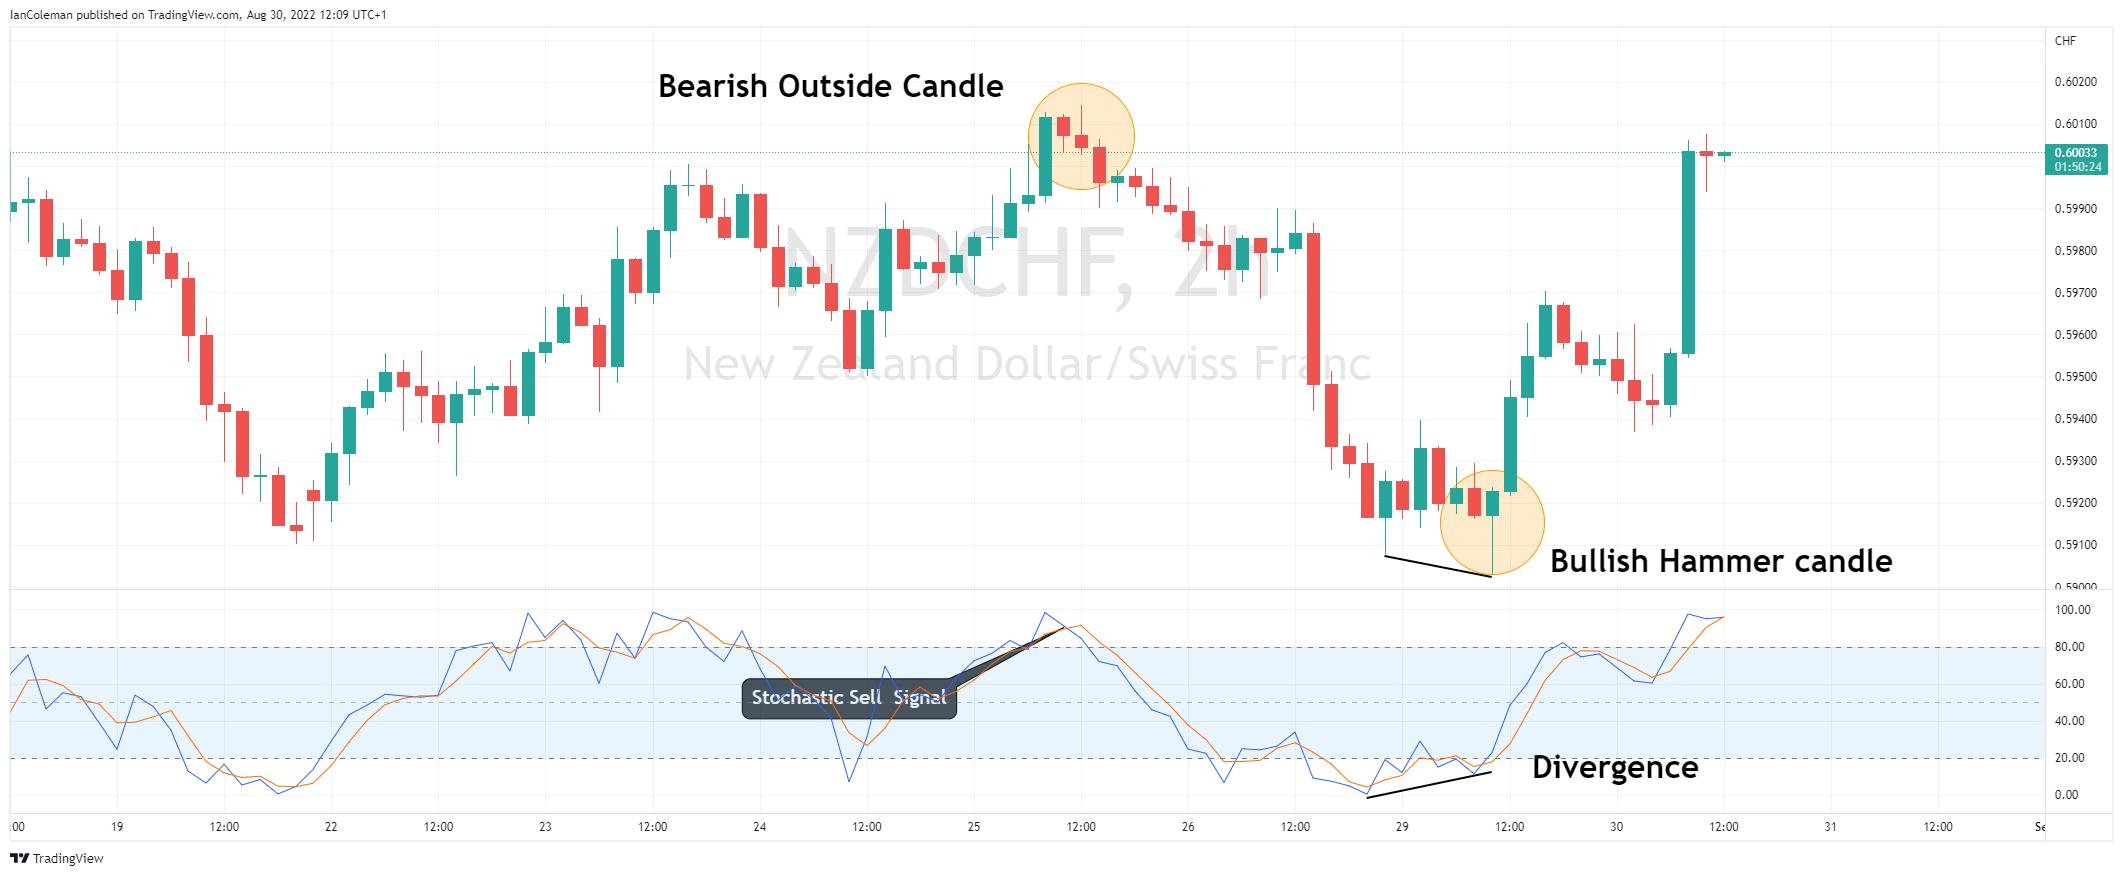
Figure 1 Trading View The Power of Confirmation
Related articles
此处提供的材料并未按照旨在促进投资研究独立性的法律要求准备,因此被视为市场沟通之用途。虽然在传播投资研究之前不受任何禁止交易的限制,但我们不会在将其提供给我们的客户之前寻求利用任何优势。
Pepperstone 并不表示此处提供的材料是准确、最新或完整的,因此不应依赖于此。该信息,无论是否来自第三方,都不应被视为推荐;或买卖要约;或征求购买或出售任何证券、金融产品或工具的要约;或参与任何特定的交易策略。它没有考虑读者的财务状况或投资目标。我们建议此内容的任何读者寻求自己的建议。未经 Pepperstone 批准,不得复制或重新分发此信息。