差价合约(CFD)是复杂的工具,由于杠杆作用,存在快速亏损的高风险。80% 的散户投资者在于该提供商进行差价合约交易时账户亏损。 您应该考虑自己是否了解差价合约的原理,以及是否有承受资金损失的高风险的能力。

This can be incredibly useful to define position sizing, which, to any trader who has been in the markets for a period will attest is one of the key variables/considerations within any trading plan.
It marries well with our assessment of risk, not just as we enter a position but throughout the full journey of that trade being ‘in the market’.
Vol defines our risk, our position sizing, but also the strategy. It is not just a major consideration for discretionary traders, but systematic (automated) too. In fact, if you’re running an EA and don’t have a vol variable in the code then I’d say the chances of doing some damage to the account longer-term increase markedly.
Volatility can be defined as realised or implied and both can be handy, you just need to find the right tool to assess vol. Realised is straight-forward – we can all see it, be it through the use of Bollinger Bands, ATR, pivot points (PP), envelopes and I can go on – there is a wide range of vol tools in the Metatrader platform.
Bollinger Bands as a vol guide
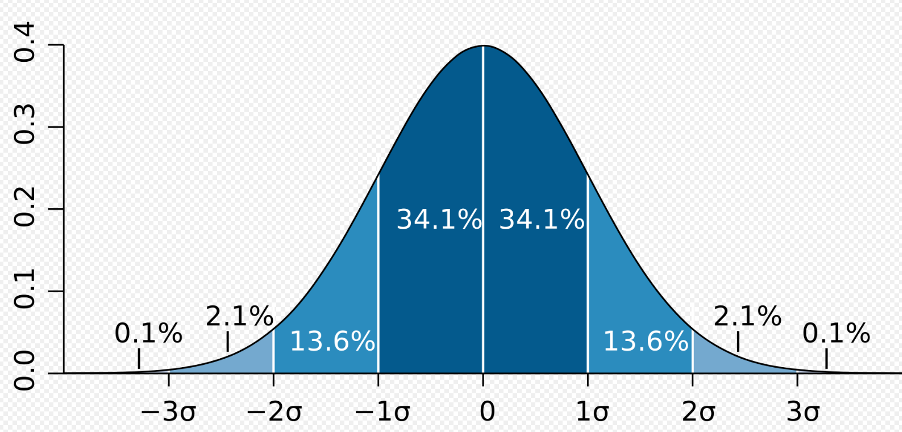
Bollinger Bands (BB) are a classic vol indicator, where we can see the bands moving wider or tighter, depending on how past distributions relate to the mean (in most cases the 20-day MA). Most retail traders don’t have a Degree in statistics and therefore have a limited understanding behind the logic behind distributions, be it normal as we see below, or one-sided. The logic in the case on BB’s is that 68.2% and 95.4% of distributions/price moves (respectively) are contained within one and two standard deviations from the 20-day MA, which is typically our mean.
Range bound (or mean-reverting) traders will use this to good effect when a market is moving sideways, especially when married with an oscillator, such as a 9- or 14-Day RSI, which will likely be trading around the 50 mark, or the mid-point, in a side-ways market – Buying into moves through the lower Bollinger Band or fading strength on moves above the top Bollinger band can be a strategy to focus on in this dynamic.
A normal distribution curve
Traders will look at the ATR (Average True Range) to get a quantifiable understanding of the recent trading range, with a view to leaving a stop loss 1 to 2x ATR. This is an effective way to manage position sizing, depending on the type of trade you are. In most cases, we need enough scope that should the trade turn, we have some ‘breathing room’ before ‘hopefully’ the tape turns and does what it is supposed to do. I say this in a somewhat cynical view, as hope is not a word we use in trading, and we react, and it’s how we react that defines the trade.
Pivot points married with implied volatility
I will often use pivot points (PP) on an intra-day basis, and as a guide to assess areas where we may see supply or bids come into the market after a move in the price - combining PP with the daily implied move derived through options pricing increases my conviction. For example, if I see the daily ‘straddle’ is pricing a 65-point move in AUDUSD (that move being higher or lower) and that move is close to the R2 or S2 (on the pivot points) then it gives me some belief of where the daily move should be contained, and because the options price is based on one standard deviation, I can hold a near 70% level of confidence here.
In the options world, this makes even more sense because market makers will have a vested interest in price not moving through the straddle price or ‘breakeven’ levels, as the buyer of volatility will be in the money.
Some will effectively combine Bollinger bands (BB) with pivot points. In fact, while the logic is wholly different, PP are similar to BB’s, as often you will see price contained intra-day by R2 or S2. Unlike BB’s, I am not sure of the statistical probability with using PP, but it would be high, at least on an intra-day basis.
With PP’s we can get information about who is deemed in control of a move, i.e. the bulls or bears, simply by seeing if the price is above or below the PP (pivot point). Naked chartists or pure price action traders would argue this is argument is clear from the candles anyhow, but it is nice to get a helping hand.
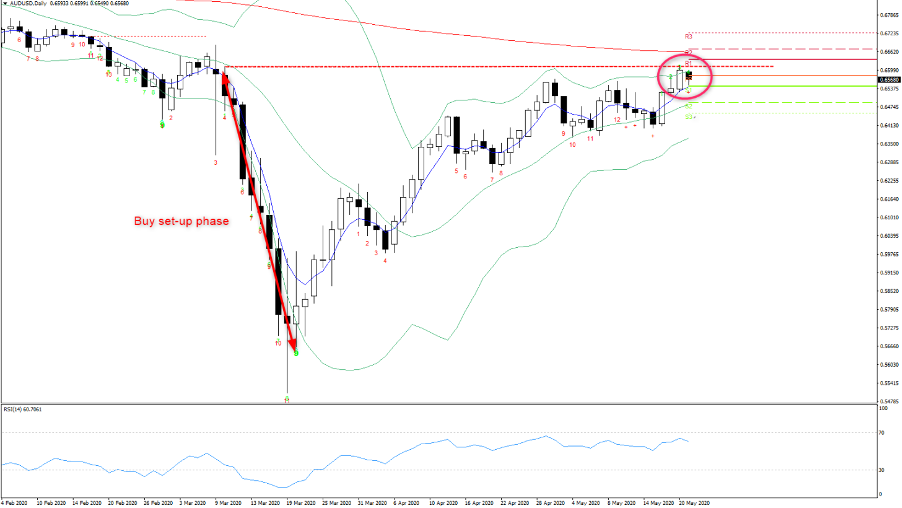
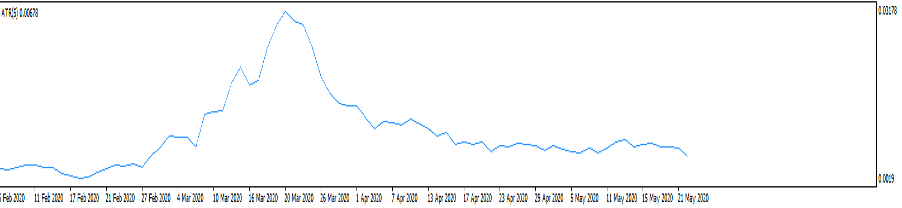
In the current AUDUSD set-up, we see the BB are narrowing, telling us realised vol is falling which we also see from the 5-day ATR (below).
In the above example, price is only just below the PP, so not giving too much away.
However, I like the fact price is holding the 5-day EMA, which is trending higher and until price closes below here then I would also expect buyers to work order into S1. The top BB intersects with R1 and R2, but we can also see resistance at the TDST resistance at 0.6612 – For those who use ID sequential would understand a closing break here be bullish and suggest the pair will resume trending higher, with the price likely hugging the upper BB, with selloffs defined and contained into 5-Day EMA. One for the radar, although I guess I’d want to see a break higher in the US500.
I won’t go into the TD sequential indicator, but we can use this indicator effectively for timing reversals and/or understanding where we are in a trend. But it also has risk control elements that can be useful.
Here’s a good video on using this indicator.
Implied volatility
Implied volatility (IV) is a consideration that gets less attention from retail FX traders, well, outside of those who trade options - Mostly as its harder to get the intel. Changes in IV is driven by options pricing and will give a sense of what the market believes is the expected movement in an instrument.
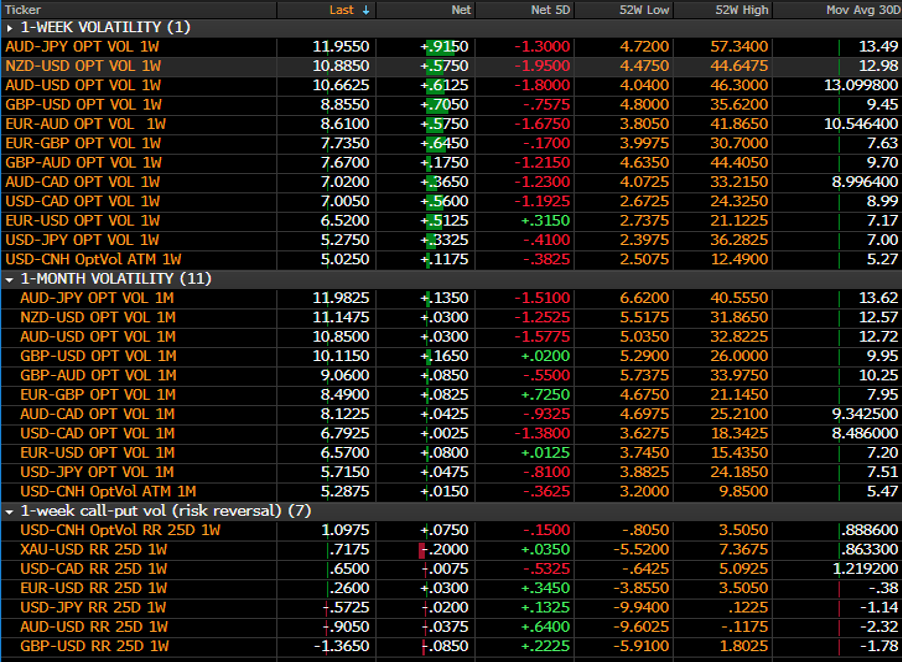
Volatility is set as an annualised (standard deviation) return, so when we look at monthly vol it looks at 1-month options which tell us the expected percentage move in spot (up or down) in the coming 12 months from current prices. We can break that down into daily, weekly, or monthly moves, by dividing the IV level by the square root of that period (time). For example, to get a daily move from 1-month vol, we know there are 250 trading days in a year. The square root of 250 is 15.8. So, if the 1-month AUDUSD implied vol is 10.86%, we know the implied daily move derived from the monthly expiry is around 0.68% (10.86/15.81).
Trading volatility is a science in itself, but I use it to understand how the market perceives future movement in an instrument over a pre-defined time frame. It will take in an element of historic/realised moves, but importantly looks ahead at all known events and makes a judgment call on the degree of movement in the underlying. I did a webinar on the subject - it is tough going, but hopefully, it can steer.
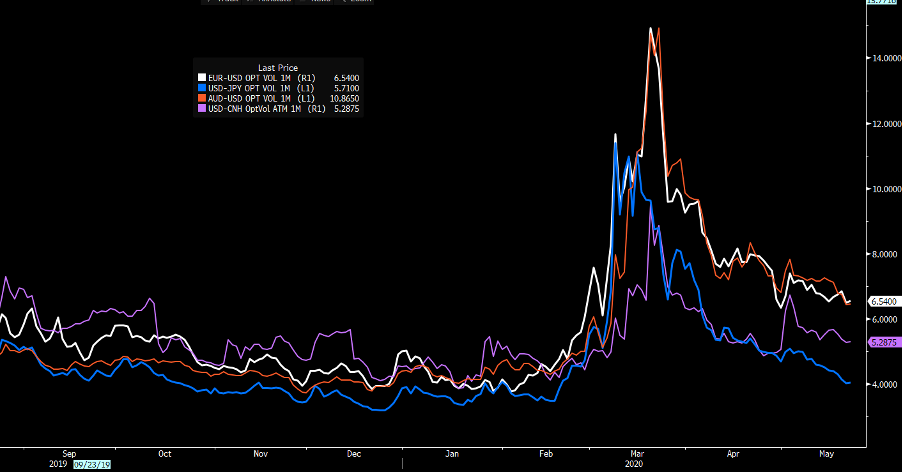
What's interesting for me right now, is vols in major FX pairs are falling hard and IV has been radically suppressed. Of course, this is down to central banks and the incredible measures they have announced, and the fact that they are moving in alignment albeit with slightly different degrees of actions – the wash-up is vols have been shot to pieces. For me, this has big implications not just on position size, but generally lower vol and positive equity markets mean carry positions tend to work far better – we often see increased flow in the MXN and TRY for example, as clients look at swap rate differentials.
But if I am looking at my AUDUSD example, and I am looking levels to fade the move intra-day, I can see this implied daily move also sits just below R2, the top BB and TDST. I am a willing seller into here, with a view to reverse the position on a daily close through 0.6611.
I often look at weekly IV and the implied move again, which may help with your perception of movement, which can help with position sizing. For those who are interested in this subject, I will cover off more on it in future.
做好交易准备了吗?
只需少量入金便可随时开始交易。我们简单的申请流程仅需几分钟便可完成申请。
此处提供的材料并未按照旨在促进投资研究独立性的法律要求准备,因此被视为市场沟通之用途。虽然在传播投资研究之前不受任何禁止交易的限制,但我们不会在将其提供给我们的客户之前寻求利用任何优势。
Pepperstone 并不表示此处提供的材料是准确、最新或完整的,因此不应依赖于此。该信息,无论是否来自第三方,都不应被视为推荐;或买卖要约;或征求购买或出售任何证券、金融产品或工具的要约;或参与任何特定的交易策略。它没有考虑读者的财务状况或投资目标。我们建议此内容的任何读者寻求自己的建议。未经 Pepperstone 批准,不得复制或重新分发此信息。