
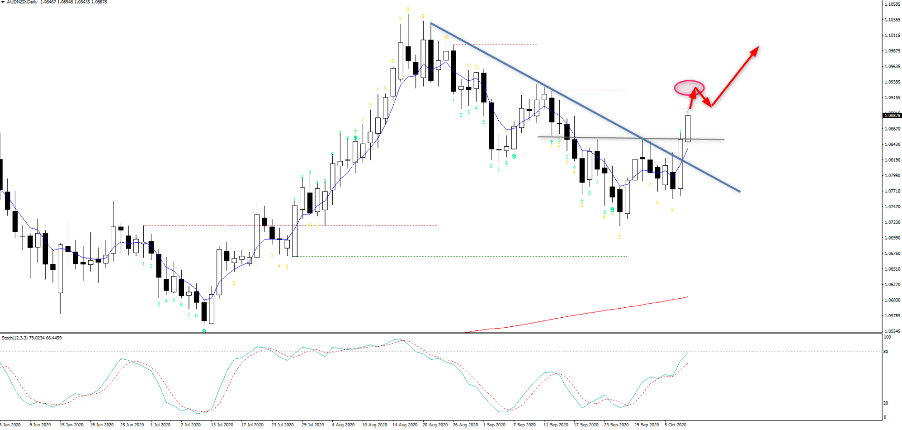
I've put it out on Trading View and on our Telegram channel yesterday – AUDNZD.
One play that can be incredibly effective in macro thematic trading is trading central bank policy divergence. Granted, if you scalp or day trade and are more interested in short-term price moves then this is not something that will interest, but to those who watch and listen to central banks closely it's a strategy that may be something they are already adopting. But the theory really plays into the notion that capital will gravitate to where the central bank policy is relatively less accommodative. Traditionally this is where funds could get yield or carry (income). While timing is always key, if one central bank is neutral and another dovish and talking about more easing you should see a trend not only in the bond and rates markets, but trending conditions in FX markets too.
Since the COVID crisis central banks have destroyed carry (by cutting rates) and even in EM, central banks have been offered scope to takes rates far lower than they’d typically be happy with and the behaviour of EM currencies has changed.
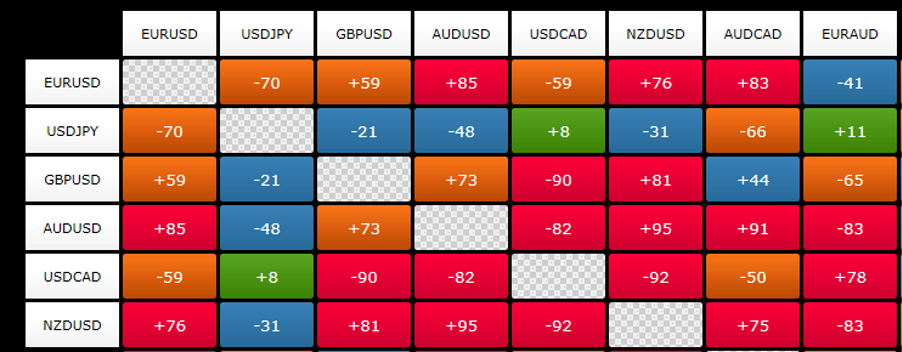
AUDNZD was always a great play here as both were sensitive to risk and are both leveraged to commodities, although one iron ore and the other dairy. Another consideration is the strong correlation between the two currencies, so playing this cross was never as wild as say GBPJPY. Statistically, the six-month correlation (using the daily percentage change) is 0.84 – if we use the price to assess correlation, we see this correlation at 0.95 – which is incredibly high. I used the ‘correlation matrix’ Smart Trader tool here.
The interesting dynamic we see is that the aggregation of capital flowing to the AUD, with price breaking the series of lower highs and the 1.0850 double top. I see 1.0925 in play as the ST target, which doesn’t give great risk reward to a trade.I would be working orders into the 5-day EMA, because if this going to trend higher I would expect this ST average to contain the selling. A daily close below the average changes that.
Fundamentally the October RBA statement suggested the November meeting is a ‘live’ meeting and if I look at the interest rates market, we see the Aussie November 30-day cash rate future trading at 8bp. We look at the change in RBA’s overnight rate, which currently sits at 13bp to assess – so in theory, if the RBA ease in November the effect would be 5bp of easing. We also see the Aussie 3-year government bond at 13.8bp, which is well under its cap of 25bp – so the market expects the bank to lower the yield target to 10bp. They could also signal more QE is coming and potentially further out the yield curve, which may bring down the 10-year bond to 75bp or so, but it’s unlikely to spur inflation.
In NZ talk of negative rates has been in play for weeks now and see this priced in the swaps curve. We heard more on this yesterday from the RBNZ, potentially adopting a tiering system. More QE could be on the cards too, but they've made it clear that they want to go bigger, sooner. I’ve always been a fan of the RBNZ as not only do they give clear projections on economic trends and expected levels for rates, but they are pro-active and get on the front foot. The RBA, on the other hand, are far slower to move and on current dynamics have made it clear the barriers to going to negative rates are incredibly high.
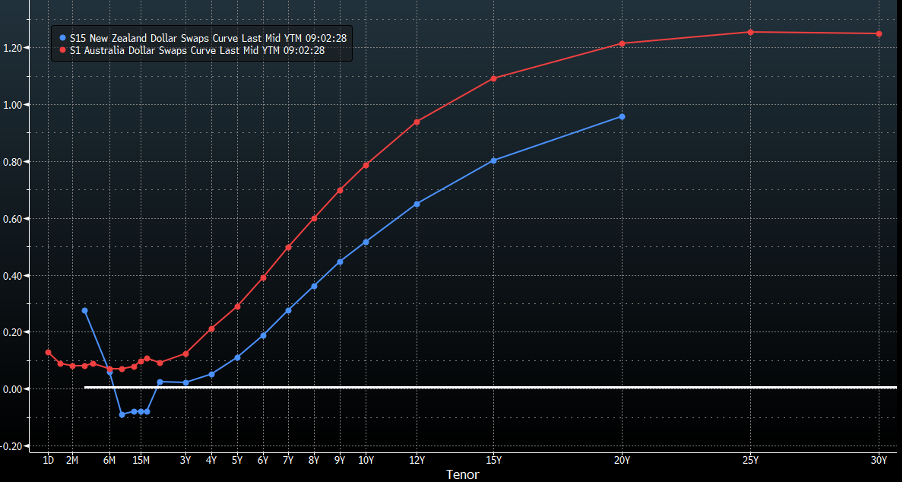
We can see NZ govt bonds trading with a negative yield out to five-year bonds, although at -0.001bp it is off the lows seen on 23 September of -7bp. Either way it’s well below the 31bp of yield you get in five-year Aussie govt. bonds. We can look at the swaps curve, which looks at interest rate expectations for specific points in time and see the difference here, especially out for two years. This portrays central bank divergence cleanly.
Here we see rate expectations in the NZ curve (blue) below that of Australia (red). The white line represents zero.
If we look relative financial conditions – which I have measured by looking at the spread in the Goldman Sachs Aus financial conditions – GS NZ financial conditions index (white) and overlap vs AUDNZD, we can see AUDNZD could be seen as ‘cheap’ and due to mean revert. Again, back the idea of near-term upside risk.
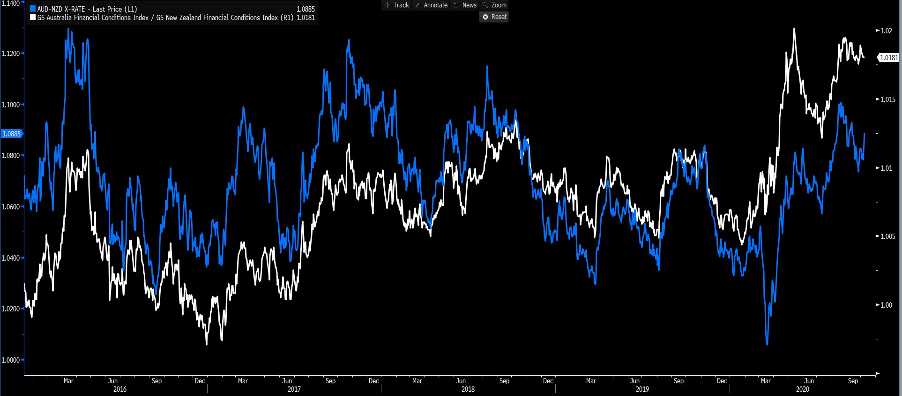
So, we need to consider what is priced and not just expected. But if we’re looking at slight divergence at a banking level then it seems price is catching up to fundamentals.
Related articles


做好交易准备了吗?
只需少量入金便可随时开始交易。我们简单的申请流程仅需几分钟便可完成申请。
此处提供的材料并未按照旨在促进投资研究独立性的法律要求准备,因此被视为市场沟通之用途。虽然在传播投资研究之前不受任何禁止交易的限制,但我们不会在将其提供给我们的客户之前寻求利用任何优势。
Pepperstone 并不表示此处提供的材料是准确、最新或完整的,因此不应依赖于此。该信息,无论是否来自第三方,都不应被视为推荐;或买卖要约;或征求购买或出售任何证券、金融产品或工具的要约;或参与任何特定的交易策略。它没有考虑读者的财务状况或投资目标。我们建议此内容的任何读者寻求自己的建议。未经 Pepperstone 批准,不得复制或重新分发此信息。